
Binance Coin has dropped to the bottom of a clear falling wedge pattern after crashing 20% against BTC pairing over the last 2 weeks. A short-term reversal could be on the cards if this particular formation plays out.
Binance Coin Daily Analysis
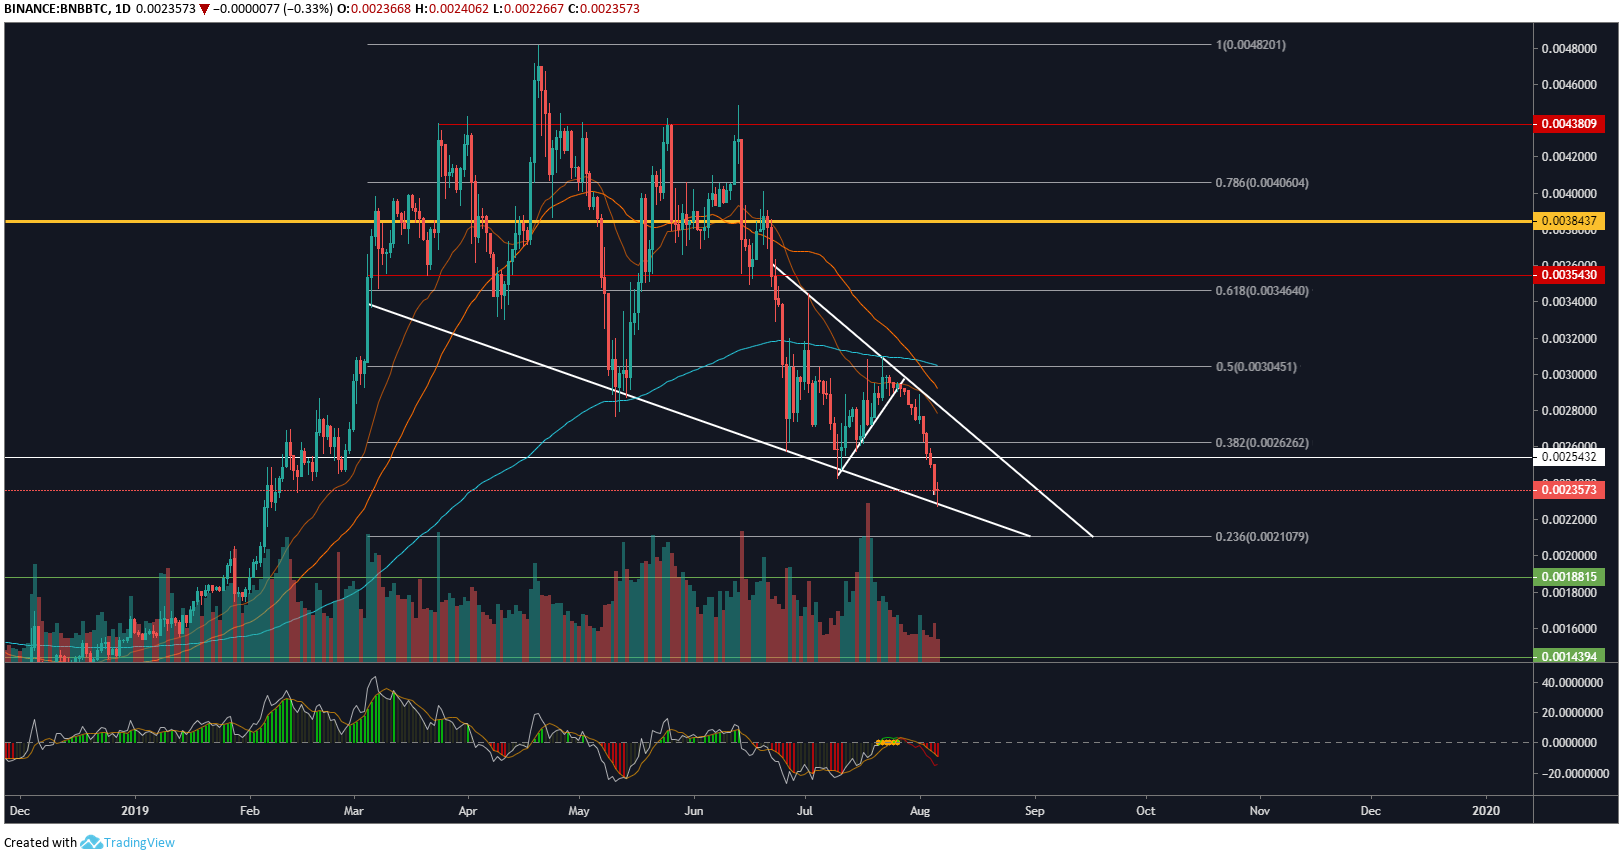
On the daily chart for BNB/BTC, we can see the wedge pattern forming in a descending fashion. Both the 50 MA and 15 SMMA have crossed down signalling bearish momentum. Maxx Momentum has also flagged what appears to be a sell signal.
Volume is awfully low and has been for the last 2 weeks as price levels dropped from 29,500 to 22,500 Sats. It’s likely that we’ll see Binance Coin’s price action bounce around the current market price of 23,500 Sats and $26 on the USD pair for BNB. However, volume will have to return to similar heights that we have seen throughout the last few months in order for a bounce to be sustainable.
Two key support levels to look out for in case price levels break down out of the wedge displayed on the technical analysis are 21,700, 18,800, and 14,300 Sats. However, given the asset’s popularity and general performance it’s unlikely price levels will drop this low.
4-Hour Analysis
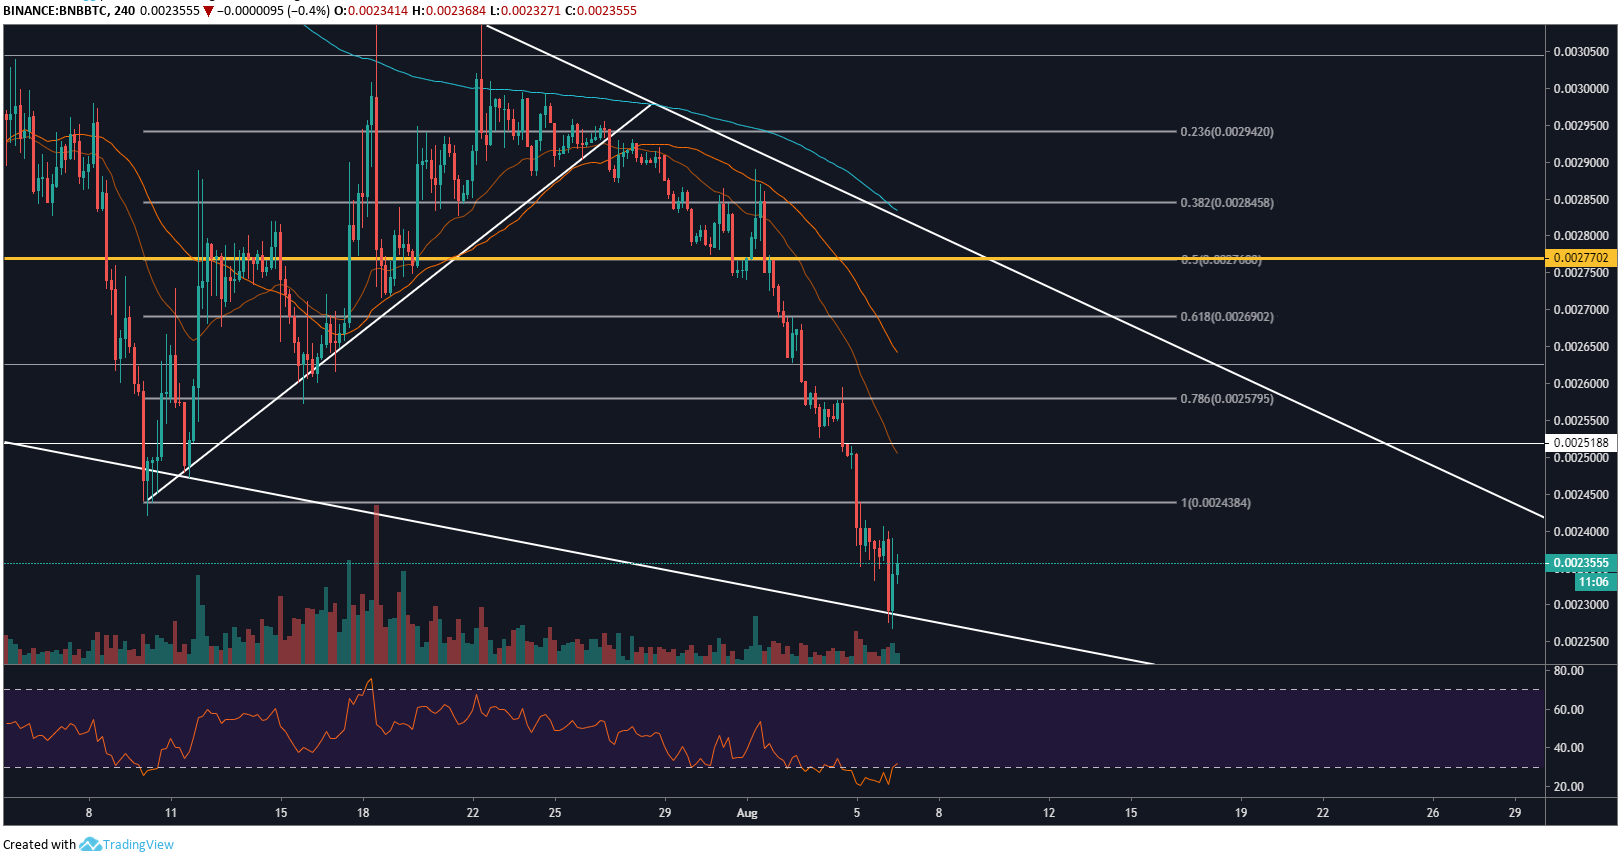
On the 4 hour chart for BNB/BTC, we can see the break-down more clearly as a result of a sharp uptrend formed throughout July mentioned in a previous analysis here. The 200 EMA has yet to drop into the descending wedge and POC (Point of Control) at 27,700 Sats still remains over 10% + from the current market price at 23,500 Sats. This is usually an indication that a bounce could happen to result in price levels re-testing the overhead wedge resistance line one more time.
Right now, the RSI clearly oversold with momentum just peaking above 30.00. This in conjunction with price levels touching the wedge support points towards a potential bounce happening over the coming days which could turn into a breakout reversal. The 50 MA at 26,500 Sats and the 15 SMMA at 25,000 Sats would be short-term targets within the wedge.
We know if price levels surpass the 50 MA a reversal is likely, and then confirmed once price levels surpass the 200 EMA. Simply using moving averages to gauge the momentum of the current short-term trend as it’s unfolding is a useful trick. However, this could all go out of the window if price levels break below the wedge support. Please refer back to the key support levels mentioned in the daily analysis above.
Do you think Binance coin is ready to bounce after the 20% drop in the last 2-3 weeks? Please leave your thoughts in the comments below!
This article is strictly for education purposes and should not be construed as financial advice.
Images via Shutterstock, BNB/BTC charts by Tradingview
The post Binance Coin Price Analysis: Bullish Reversal On The Cards appeared first on Bitcoinist.com.