- There was a steady decline in bitcoin below the $8,500 support against the US Dollar.
- The price is following a bearish path and it is facing many hurdles near $8,200 and $8,500.
- There is a key declining channel forming with resistance near $8,200 on the 4-hours chart of the BTC/USD pair (data feed from Kraken).
- The price could extend its decline towards the $7,850 support area before it could start a recovery.
Bitcoin price is declining and is trading in a bearish zone below $8,500 against the US Dollar. BTC is likely to decline further to $7,850 or $7,500 before a decent upward move.
Bitcoin Price Weekly Analysis (BTC)
This past week, BTC started a short term recovery from the $7,659 low against the US Dollar. The BTC/USD pair traded above the $7,800 and $8,000 resistance levels. Moreover, there was a break above the $8,200 resistance area. Finally, the price tested the $8,500 resistance area and topped near the $8,539 level. Recently, it started a fresh decline and traded below the $8,400 level.
The price is now following a bearish path below the $8,200 level and is trading well below the 100 simple moving average (4-hours). There was a break below the 50% Fib retracement level of the upward move from the $7,659 low to $8,539 high. At the moment, the price is holding the $8,000 support level, with a bearish angle. An immediate support is near $8,000. It coincides with the 61.8% Fib retracement level of the upward move from the $7,659 low to $8,539 high.
More importantly, there is a key declining channel forming with resistance near $8,200 on the 4-hours chart of the BTC/USD pair. Bitcoin remains at a risk of more downsides below the $8,000 support area. If it breaks $8,000, it could decline towards the $7,850 support area. Any further downsides might trigger a move towards the $7,500 support area in the near term.
On the upside, there are many hurdles near the $8,200 and $8,300 levels. The first major resistance is near the $8,500 level. However, the main resistance is near the $8,600 level and the 100 simple moving average (4-hours). There is also a connecting bearish trend line forming with resistance near $8,600 on the same chart.
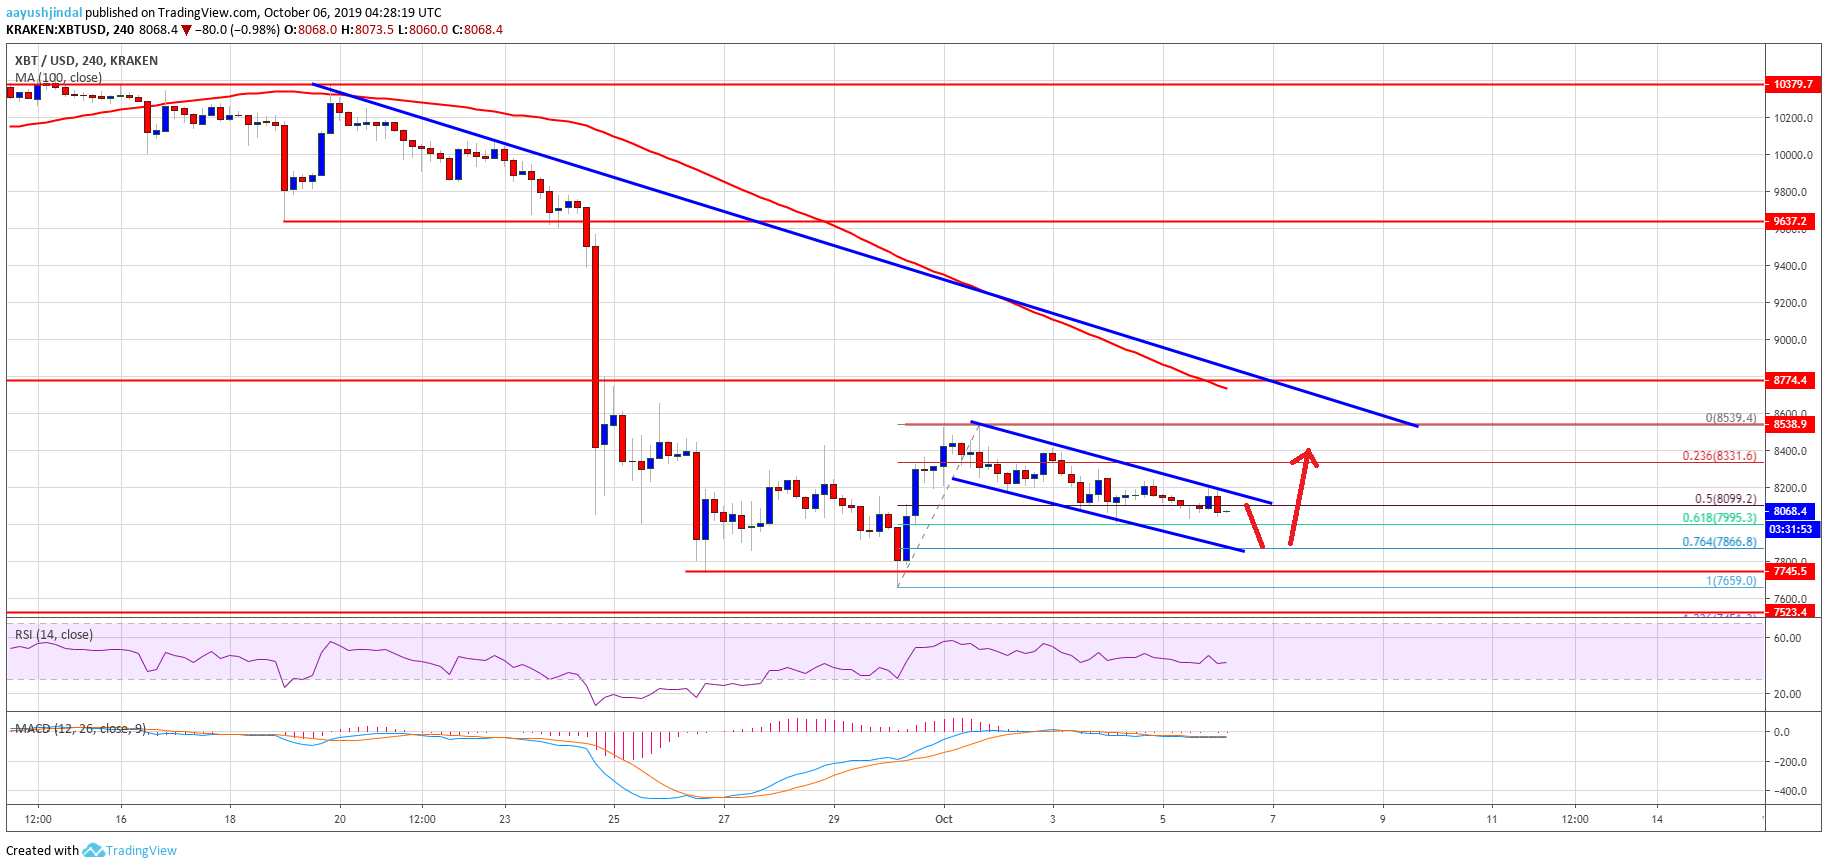
Looking at the chart, bitcoin price is clearly following a bearish path below $8,500. As long as there is no close above $8,500 and $8,600, there is a risk of a sharp decline towards $7,500.
Technical indicators
4 hours MACD – The MACD for BTC/USD is slowly moving into the bearish zone.
4 hours RSI (Relative Strength Index) – The RSI for BTC/USD is now well below the 50 level.
Major Support Level – $7,850
Major Resistance Level – $8,500
The post Bitcoin (BTC) Price Weekly Forecast: Bears Remain In Full Control appeared first on NewsBTC.