Bitcoin’s recent price surge has led to the formation of a golden cross as the 50-day moving average has gone over the 200-day moving average. Although it’s considered a lagging indicator, previous similar cases have resulted in further price increases for BTC, with investors anticipating a similar move now as well.
Bitcoin Golden Cross Took Place
This popular indicator occurs when a short-term moving average (the 50-day one in this case) surpasses a major long-term moving average (200-day) to the upside. Consequently, it works precisely in the opposite way of the death cross, and analysts typically regard it as a long-term bullish signal.
History shows numerous such examples in BTC’s over a decade-long existence, with some of the most brought up ones at the end of 2015 and at the start of 2019. Both cases propelled significant price appreciations for the primary cryptocurrency.
Another example occurred in May 2020, when the asset struggled below $10,000. In the following months, it skyrocketed, doubled its value, and continued towards uncharted territory.
Bitcoin’s price recovery from the recent slumps has caused the 50-day moving average to increase, while the longer – 200-day MA – has remained relatively stable. Thus, the formation of the golden cross happened with yesterday’s close, as pointed out by several well-known BTC analysts.
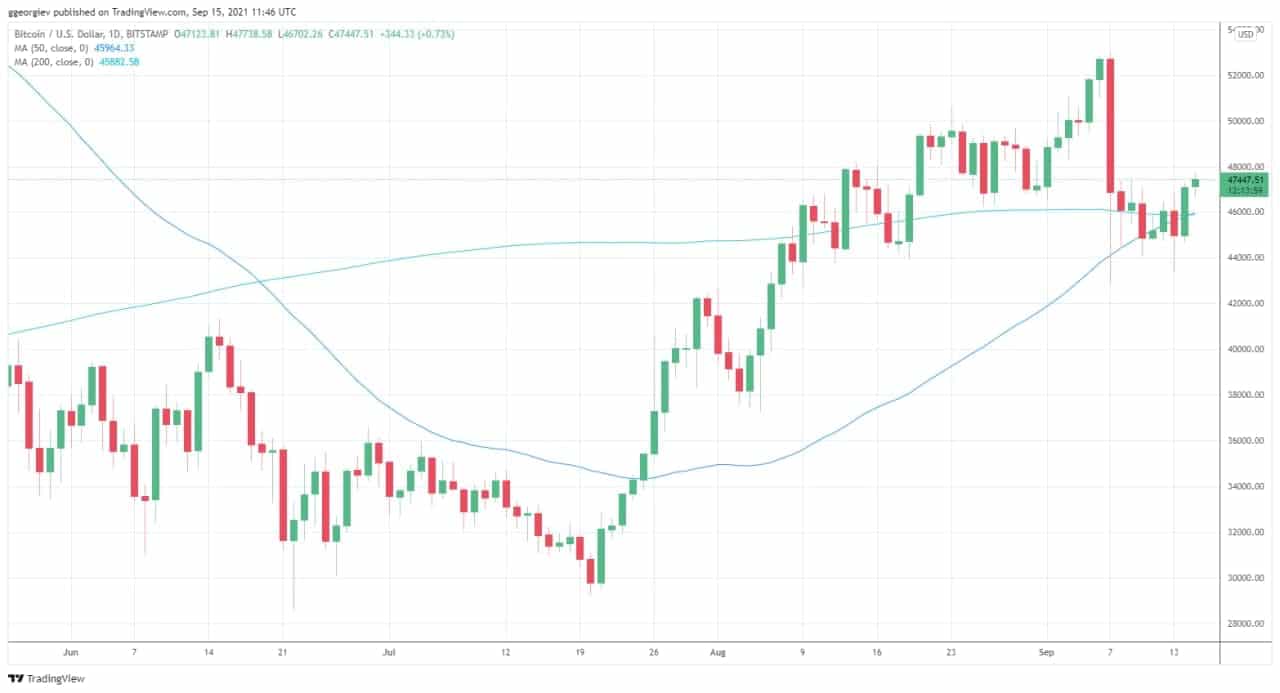 BTCUSD Golden Cross Formation. Source: TradingView
Is $50K Next?
As mentioned above, bitcoin has been on a roll in the past few days, especially after the Monday roller-coaster when it ultimately dropped to $43,400. It has recovered more than $4,000 in two days, which enabled the closure above $47,000 to form the golden cross. Moreover, this increase came despite the most recent FUD coming from China.
According to the on-chain analyst Will Clemente, BTC could continue upwards to the August high of $50,000 if it successfully breaks and maintains above $47,000. In the hours after the golden cross, bitcoin dipped slightly beneath that level but has reclaimed it rather rapidly and currently stands several hundred dollars above it.
Back above the 200DMA, now facing a bit of resistance at Monday’s high/September’s Monthly open ($47K-$47,150)
If those levels are indeed broken, could see a pretty swift move up to August’s high at $50.5K pic.twitter.com/aYJPkbFAFL
— Will Clemente (@WClementeIII) September 14, 2021
Further technical analysis shows the importance for BTC to close the week above the 200-day moving average before a potential retest of the $50,000 level.
It’s worth noting, though, that investors should be wary of the so-called price fakeouts – these are situations when the 50-day MA surpasses the 200-day MA briefly before it returns below it once again. This only confirms the belief that the golden cross should be viewed as a longer-term indicator.