
After a sideways market all through June, Bitcoin is not doing too hot this month. The past 48 hours have been brutal for the cryptocurrency as it dropped over 10% dipping below the $10,000 level. Why is the price falling? Will we see recovery anytime soon? Let’s dive deeper and take a look…
Why is Bitcoin’s price falling?
As Coindesk reports, a key indicator for Bitcoin has turned bearish. Specifically, the MACD indicator turned bearish first time since December. If you trade based on technical indicators, then these are pretty bad news.
The sideways market last month may have contributed to something called buyer exhaustion. According to Investopedia:
“Exhaustion is a situation in which a majority of participants trading in the same asset are either long or short, leaving few investors to take the other side of the transaction when participants wish to close their positions. Exhaustion often signals the reversal of a current trend because it illustrates excess levels of supply or demand, indicating a market is either overbought or oversold.”
While the trading volume is still relatively strong this month, it’s not stronger than it was the month prior. In order to sustain the bullish run we also need to see an increase in volume, when volume dies down so does the market’s power to make strides ahead.
Another potential reason for Bitcoin’s recent bearish momentum includes president Trump’s recent tweet about the cryptocurrency:
I am not a fan of Bitcoin and other Cryptocurrencies, which are not money, and whose value is highly volatile and based on thin air. Unregulated Crypto Assets can facilitate unlawful behavior, including drug trade and other illegal activity….
— Donald J. Trump (@realDonaldTrump) July 12, 2019
We have seen Trump’s tweets move stock markets up and down, and its no coincidence that after his tweet Bitcoin experienced some bearish momentum. However, regardless of Trump’s opinion on Bitcoin, the cryptocurrency will continue to stride along like the honey badger that it is.
Bitcoin Price Analysis And Prediction
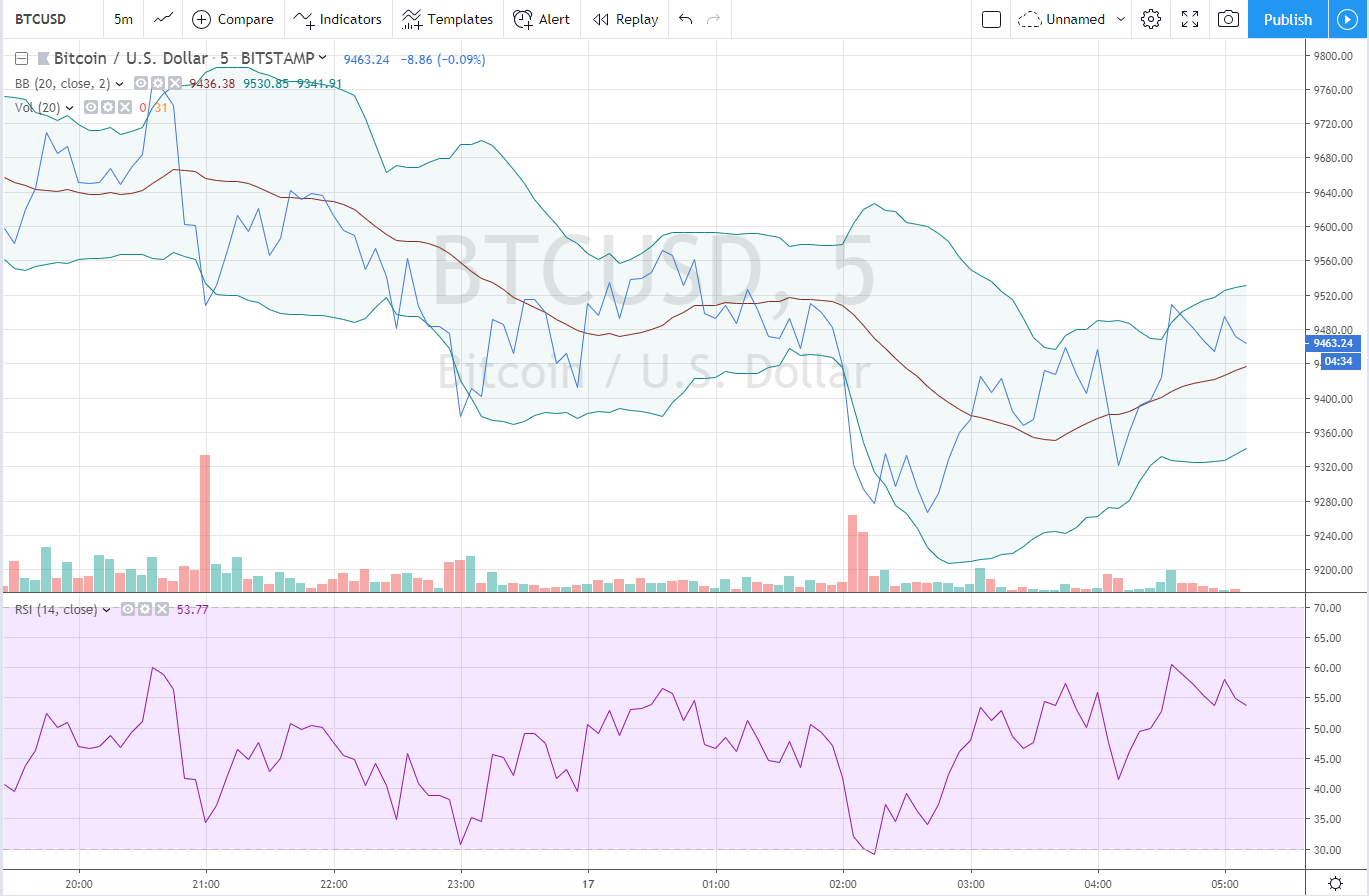 Relative Strength Index: The current RSI is at a healthy 55 points. That means the market is neither overbought nor oversold. Most likely the market will continue trading sideways until it can build up more strength for its next move.
Bollinger Bands: The current price of $9463 is within the upper and lower bollinger bands. This means that there isn’t any negative or positive pressure for the market as of right now.
Prediction: Both indicators are showing a healthy market that will most likely continue its sideways trend. Remember this is an intraday analysis so the sideways trend is predicted for the next 24-48 hours, after which the indicators may tell a completely different story.
Disclaimer: This is not trading or investment advice. The above article is for entertainment and education purposes only. Please do your own research before purchasing or investing into any cryptocurrency or digital currency.
The post Bitcoin Price Down Over 10%, Sinking farther away from $10,000 appeared first on The Merkle Hash.