Bitcoin has hit $12,400 and $11,100 within the last two weeks but still, the price is range-bound. The range being $12,500 to $10,850.
Since bitcoin’s tap at the $11,500 low on August 5, the price has managed to form a bearish pattern – rising wedge. Hence, in the short-term bitcoin has a bearish outlook.
Bitcoin 1-hour chart
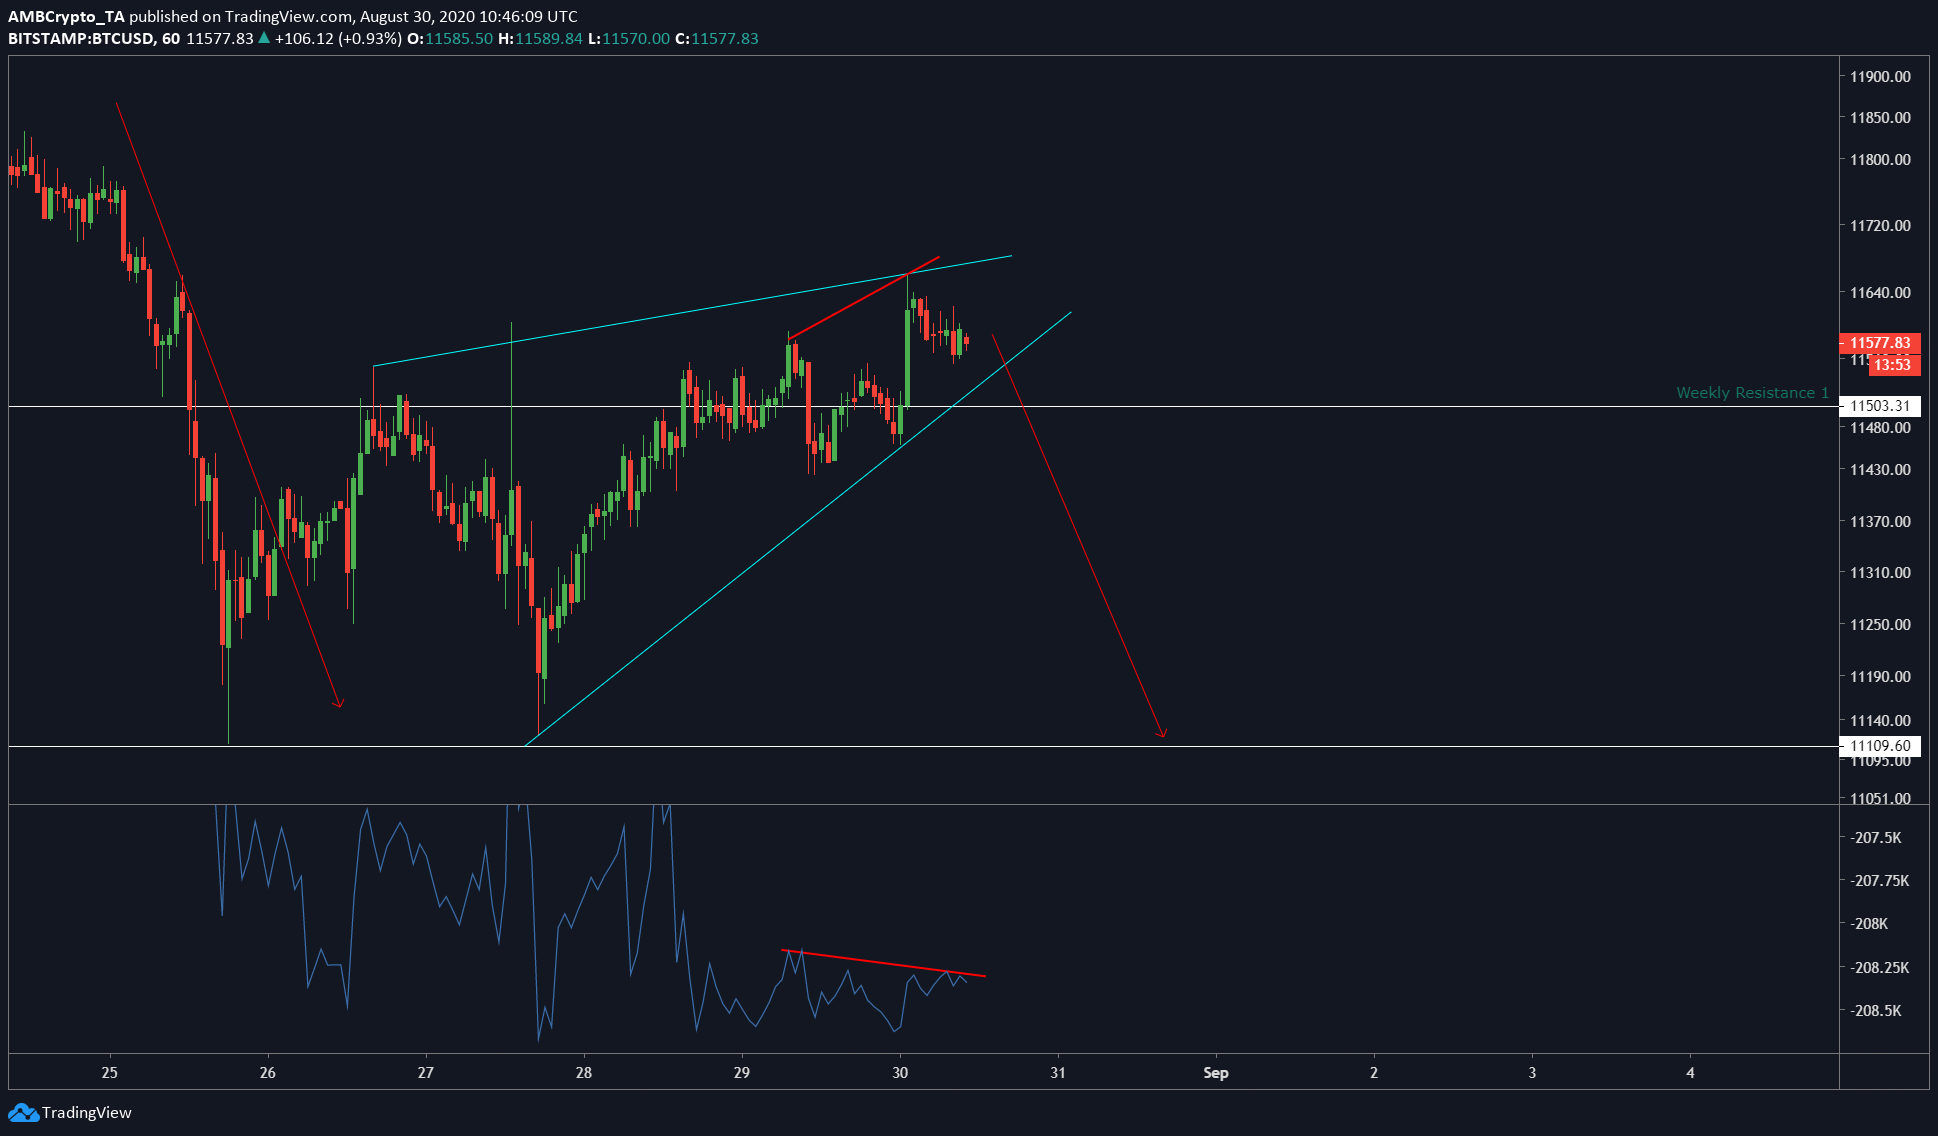
BTCUSD TradingView
From the above, we can see a downward preceding trend before the formation of the rising wedge. This and the rising wedge form a continuation pattern, which means a downtrend is inevitable for bitcoin.
Add that to the already bearish nature of a rising wedge, it further solidifies the short-term outlook. To further help the case for bears, there is a bearish divergence between the price [that has formed a higher high] and the OBV [which has formed a lower high]. Therefore, opening a short position for BTC would be the best thing to do here.
The target would be $11,110 which is approximately 4% from the current price. Leveraging the trade could further increase the profits, however, that would also increase the risk. Hence, special care should be taken if the trade is leveraged.
For now, stop-loss could be as high as $11,700 as the wicks have recently hit $11,660 and the surrounding area. This stop-loss would mean risking 1% of the initial capital, should the position liquidate.

BTCUSD TradingView
On a higher time frame of 1-day, the current candle seems to signify a reversal in trend with a higher high. Although this could turn to be a fakeout as the current candle is still yet to be close. Also, the price has witnessed a strong resistance at this level previously on July 27 and August 13.
The post Bitcoin short-term price analysis: 30 August appeared first on AMBCrypto.