
Bitcoin SV Price Analysis (BSV/USD)
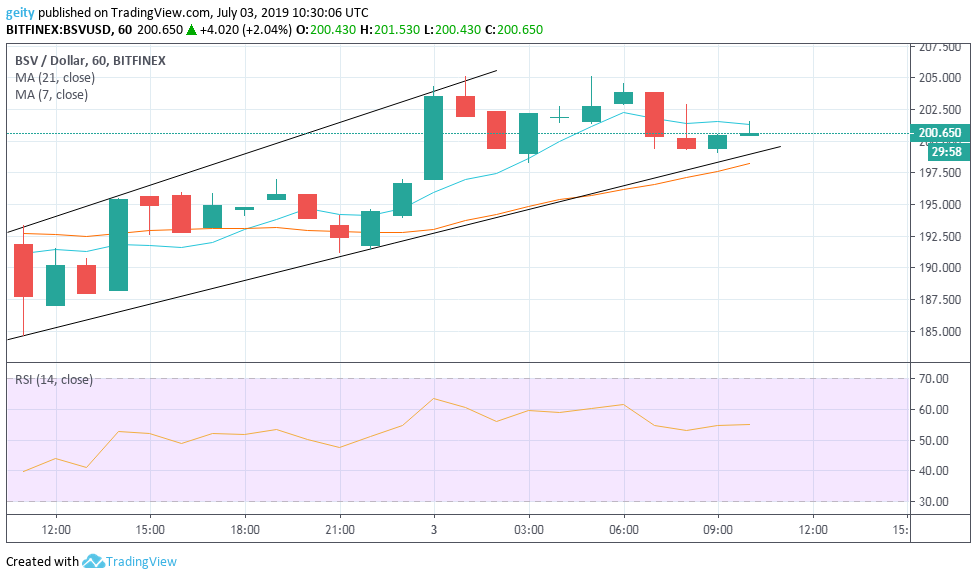
BSV/USD pair has exhibited a bullish outlook in the last 24hrs. The ascending channels reflected the upward price rally. The 7 day MA that was seen gravitating above the 21 day MA that indicated a bullish signal.
BSV/USD pair began trading yesterday at $187.720 and is currently trading at $200.650. This confirmed that the pair’s price has surged by 6.4% over the last 24hrs. Support level has been moved up from $192.396 to $198.874 that indicated a bullish momentum.
The RSI indicator has moved up from level 40 to 60, which indicated that buyers had dominated the market momentum; thus, increase buyouts. The Bull Run of BSV price has been promoted by the BSV mining pool that was launched by ViaBTC that offers users 70% fee discounts. Notably, the deal is part of the launch promotion period that will run until July 23.
Bitcoin SV Price Prediction
At the press time, the 7 day MA is above the 21 day MA, but the moving averages are trending towards each other. This shows that the market is likely to encounter a period of consolidation or a sideways price movement in the next few hours. New targets should be stood at $204.000.
Ethereum Price Analysis (ETH/USD)
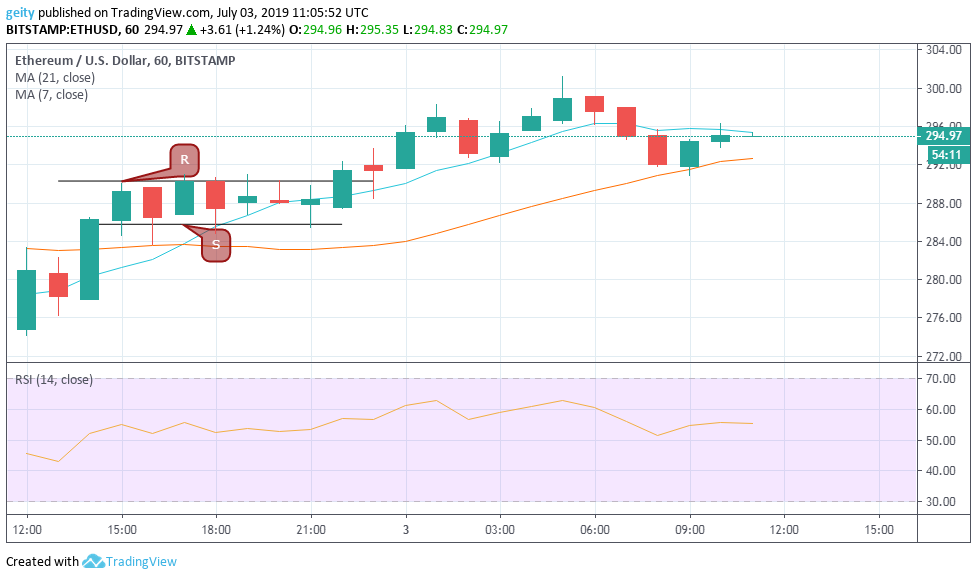
A Bullish Run is seen in the last 24hrs that has been buttressed by the 7 day MA that is currently trading above the 21 day MA. ETH began trading yesterday at $280.98 that was followed by an upward price rally that shifted the price up. ETH price later on consolidated between $290.31 (R) and $285.79 (S) level.
This was followed by a continuous upward rally that shifted the momentum up to a high of $301.25. The RSI was seen trading between the level of 40 and 60 that indicated a lack of momentum in the market. Increase in ETH price has positively affected investors. The upward price rally of ETH has been promoted by the fact that yesterday, the daily transaction registered by Ethereum (ETH) network exceeded one million.
Ethereum Price Prediction
All indicators point toward a bullish signal. Seeing that the 7 day MA IS still on top of the 21 day MA, and the RSI indicator is currently heading north which signals a Bull Run. New targets should be set at $300.00.
Bitcoin Cash Price Analysis (BCH/USD)
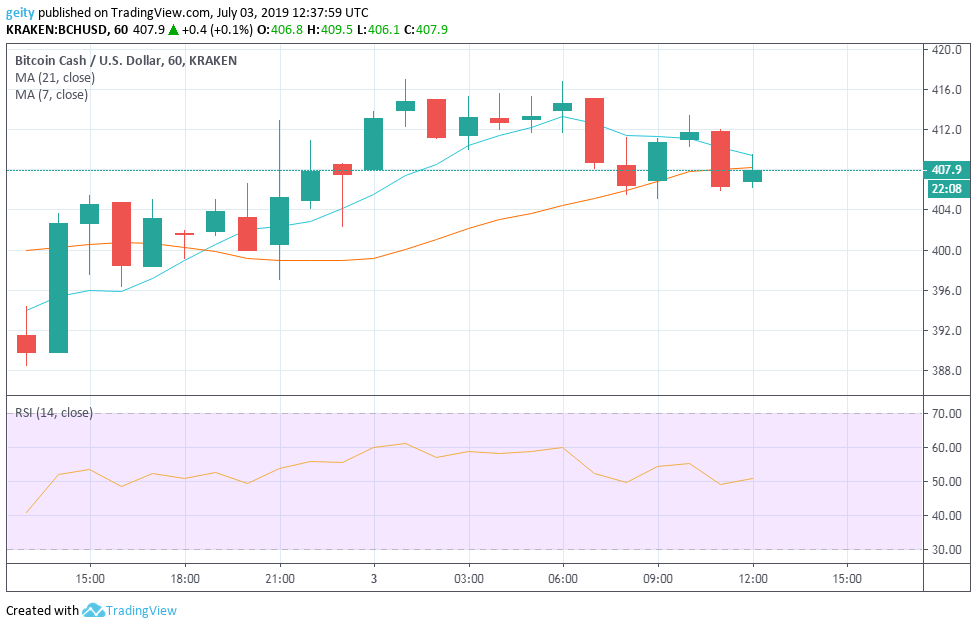
Like the other two cryptos, BCH has exhibited a bullish outlook during the last 24hrs with both indicators pointing towards the bullish signal. The upward price rally was supported by the 7 day MA that is currently above the 21 day MA.
BCH/USD pair is down by 4.4% having moved from yesterday’s price of $389.8 to the current price of $407.9. The RSI indicator is trending between level 40 and 60 that indicated a lack of momentum in the market. The RSI is currently heading north which shows reluctance of investors to sell off their BCH holding in anticipation for better prices.
Bitcoin Cash Price Prediction
If the bulls do not up there move, they may be overcome by the bears. Seeing that at the moment, the 21 day MA is gravitating towards the 7 day MA and is set to cross above the 7 day MA in a triangular contracting pattern that indicates a bearish signal.
Disclaimer: This is not trading or investment advice. The above article is for entertainment and education purposes only. Please do your own research before purchasing or investing into any cryptocurrency or digital currency.
Image(s): Shutterstock.com
The post Bitcoin SV (BSV), Ethereum (ETH) and Bitcoin Cash (BCH) Price Prediction And Analysis For July 3rd 2019 appeared first on The Merkle Hash.