If you had purchased $1000 worth of Bitcoin (0.13BTC) on 1 January 2020, it would be worth $1509.10 today. On the contrary, an investment of $1000 in Gold on the same day (0.65 oz) would be worth only $1277.10 today. Furthermore, if you had purchased $1000 worth of Bitcoin in 2013, your investment would be worth upwards of $85,000.
The point here is that the RoI of Bitcoin is higher than most, irrespective of the fact that the underlying correlation has increased over the past 90 days. This is especially so when it is presented against the likes of Gold.
On examining the correlation between the two using this chart, the aforementioned increasing correlation can be confirmed.
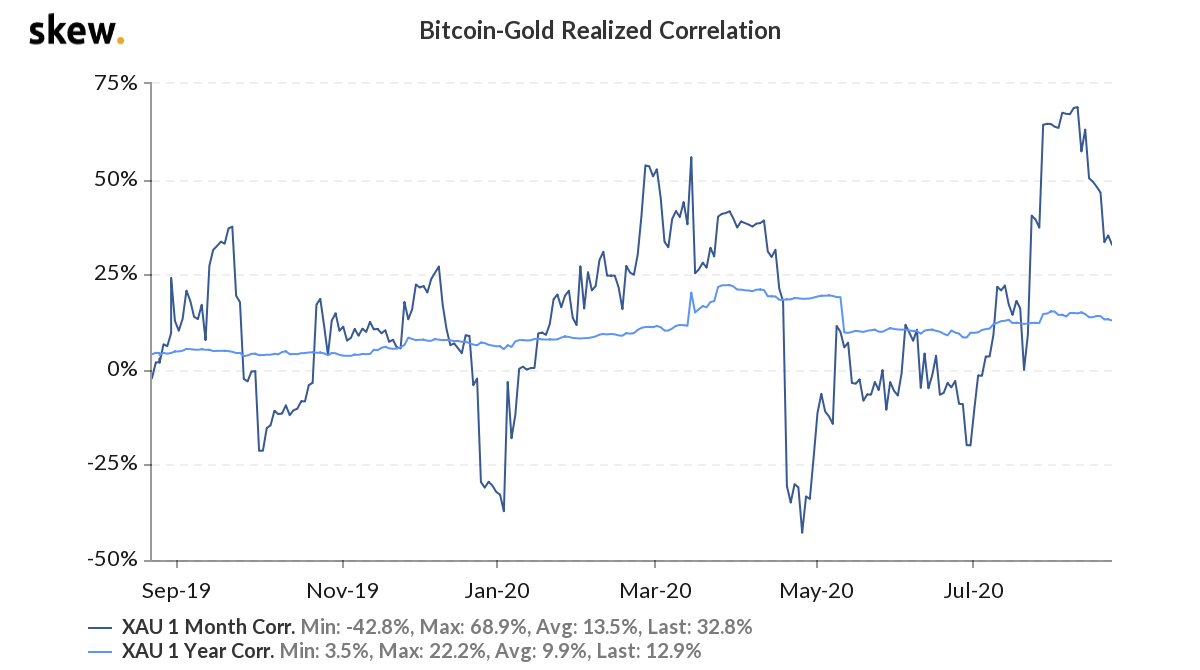
Source: Skew
According to this chart, the correlation, at the time of writing, was above 50%. It should be noted, however, that it often oscillates around zero, on both the positive and negative sides, hitting high correlation only briefly (The reason for this correlation has been discussed further here). From this, it can be deduced that Bitcoin’s growing correlation with an asset that is traditionally considered a safe haven may be a sign of its stronger fundamentals. With stock exchange day traders emerging as new buyers, increasing demand has fueled a steady rise in price across spot and derivatives exchanges.
However, what can we deduce from the quarterly return charts for Bitcoin and Gold?

Source: Skew
Bitcoin’s RoI has been consistently higher than gold and other macro-assets in YTD. Further, an important observation here is the RoI on the USD side has been consistently lower over the past month and quarter. This could be a contributing factor to Bitcoin’s consistently high returns and a positive correlation with gold over the past quarter.
For traders on derivatives exchanges, this is an affirmation of the fact that the factors driving Bitcoin’s price growth are negative returns on USD and Bitcoin’s correlation with gold. Watching these two factors can help develop a strategy for a long call and a short put.
A look at the quarterly returns for Bitcoin over the years is useful too.

Source: Skew
Since 2014, Bitcoin has assured positive returns three quarters in a row a few times – From Q4 2016 to Q2 2017 and all four quarters in 2017. Here, it can be observed that the aforementioned timeframe overlapped with Bitcoin’s historic bull run and the same could be expected when the 2020 bull run kicks off.
Right now, Q4 2020 price predictions for Bitcoin remain consistently bullish, owing to the fact that there is increasing interest from institutional investors and liquidity from crypto-crypto exchanges.
PlanB’s model is one such price prediction, with the analyst’s assessment of Bitcoin’s charts a little closer to realization.
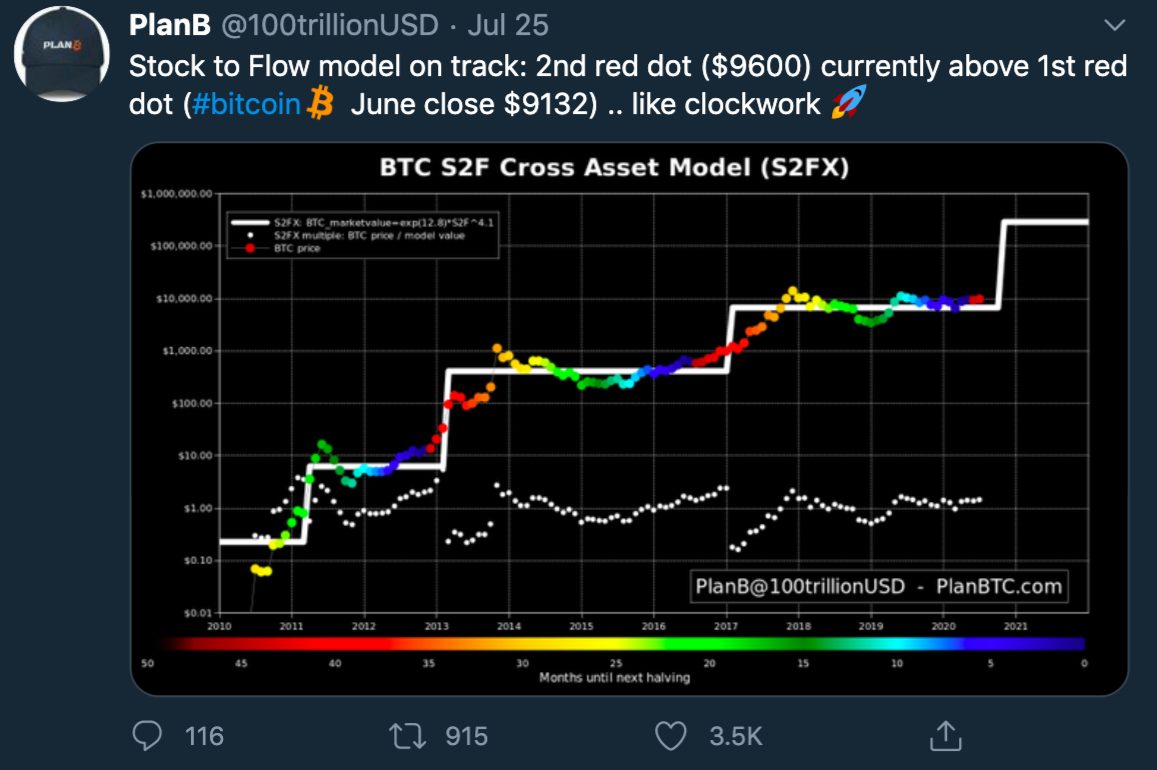
Source: Twitter
In fact, his latest S2F Cross-Asset Model (with some deviation) had also predicted Bitcoin’s approximate price post the halving event in May, with the prevailing perception being that sustained Open Interest in Bitcoin Futures and new demand from buyers on fiat-crypto exchanges can boost the world’s largest cryptocurrency’s price.
The post Here’s why Bitcoin’s Year-to-Date RoI is greater than Gold’s appeared first on AMBCrypto.