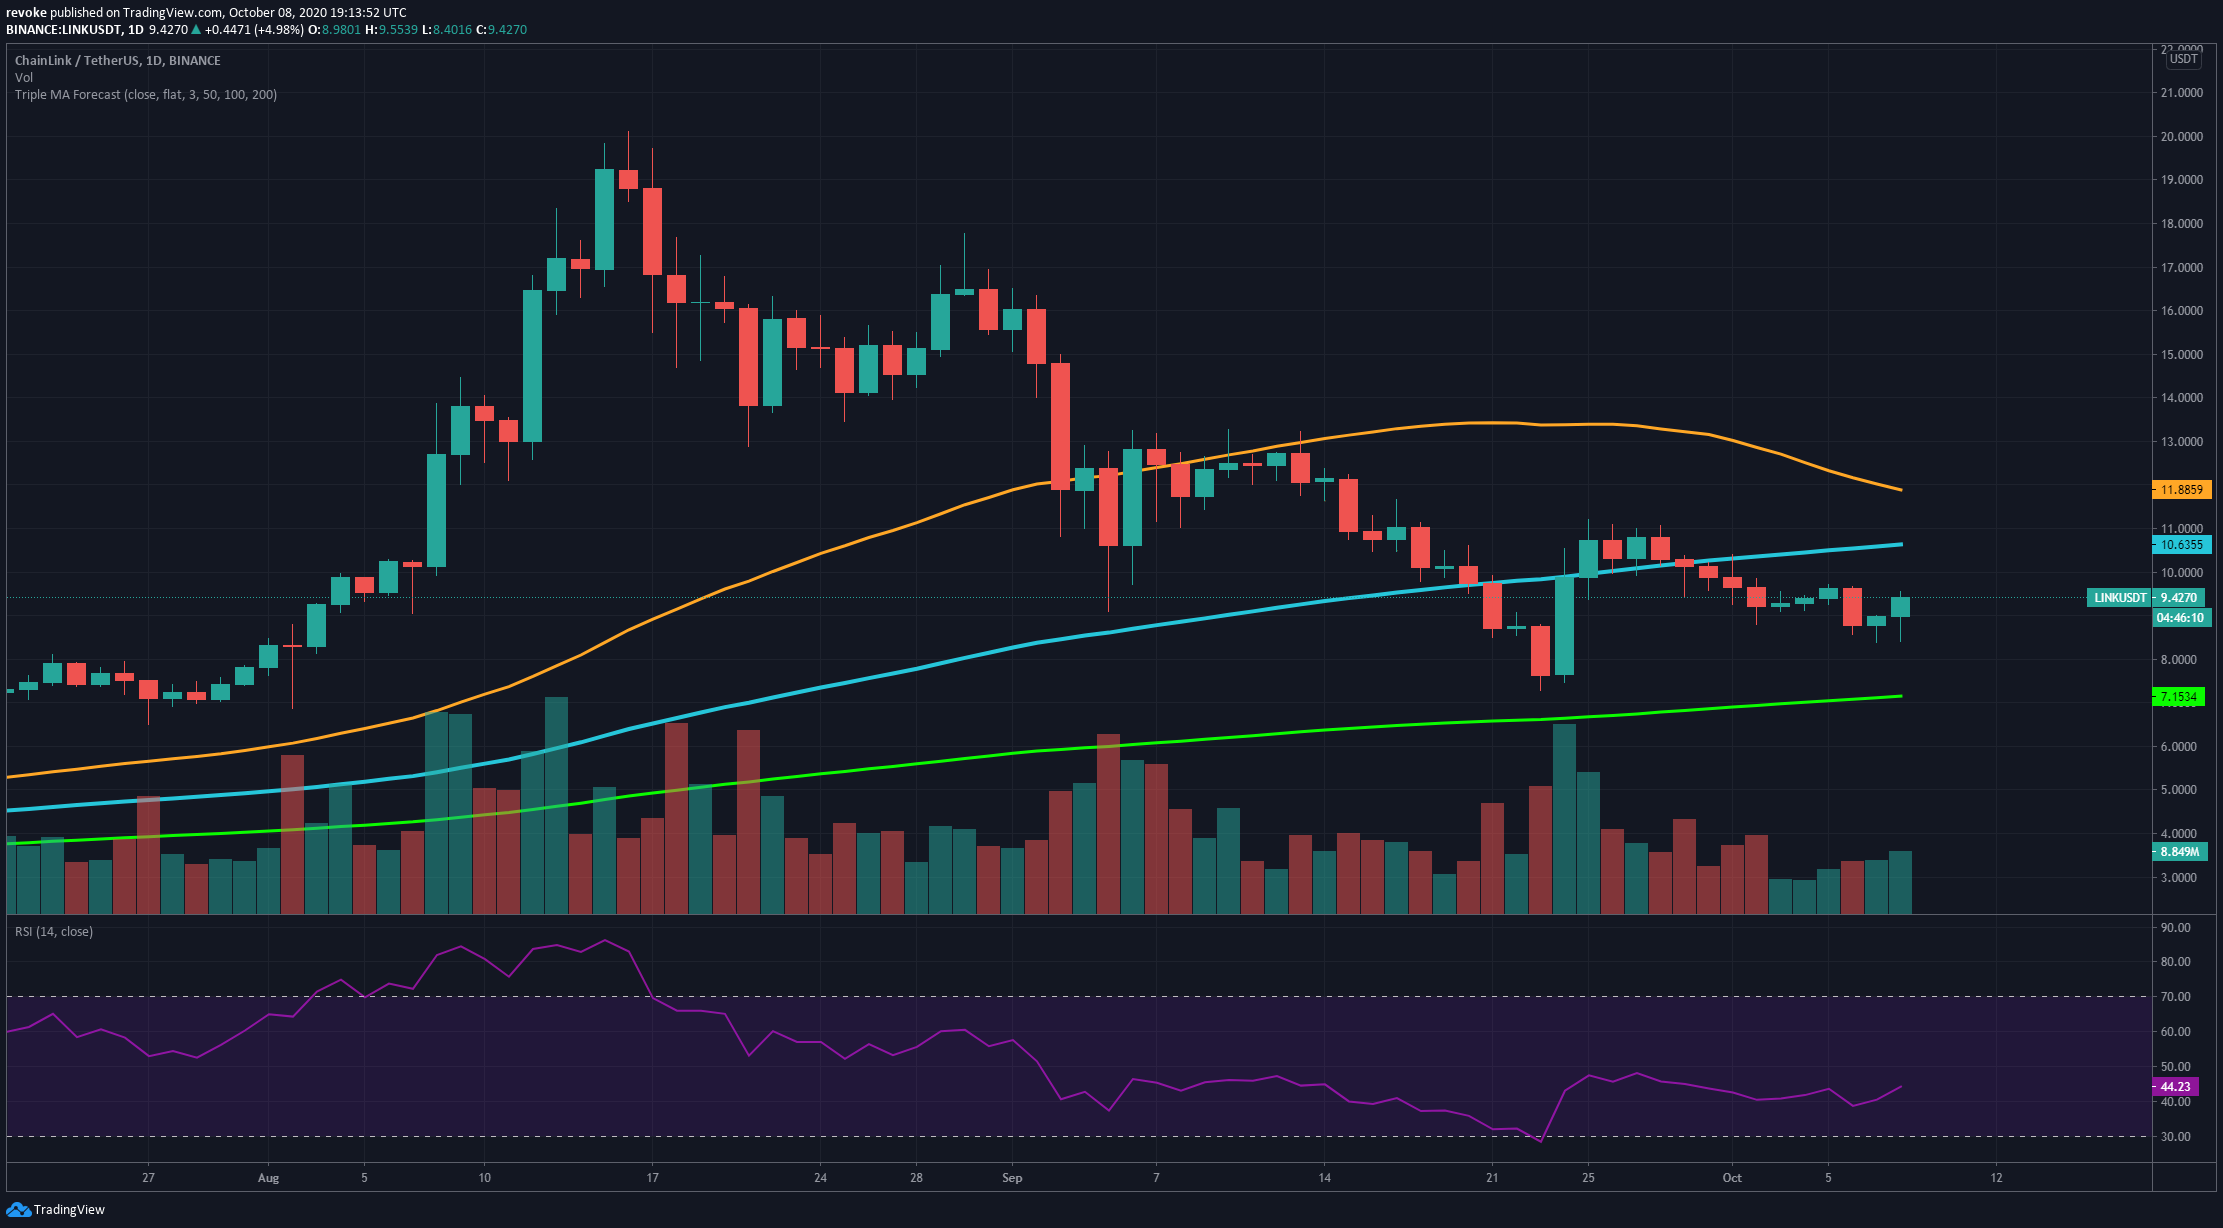
Unfortunately, the run was short-lived, and the currency is now down more than 50% since its all-time high. On the daily chart, the 100-SMA has been acting as a strong resistance level, broken a few times from September 24 to 28, but ultimately rejecting the price.
Bulls seem to have established a possible higher low at $8.38 compared to $7.28, and they could be on their way to change the daily downtrend.
LINK is trying to change the short-term momentum
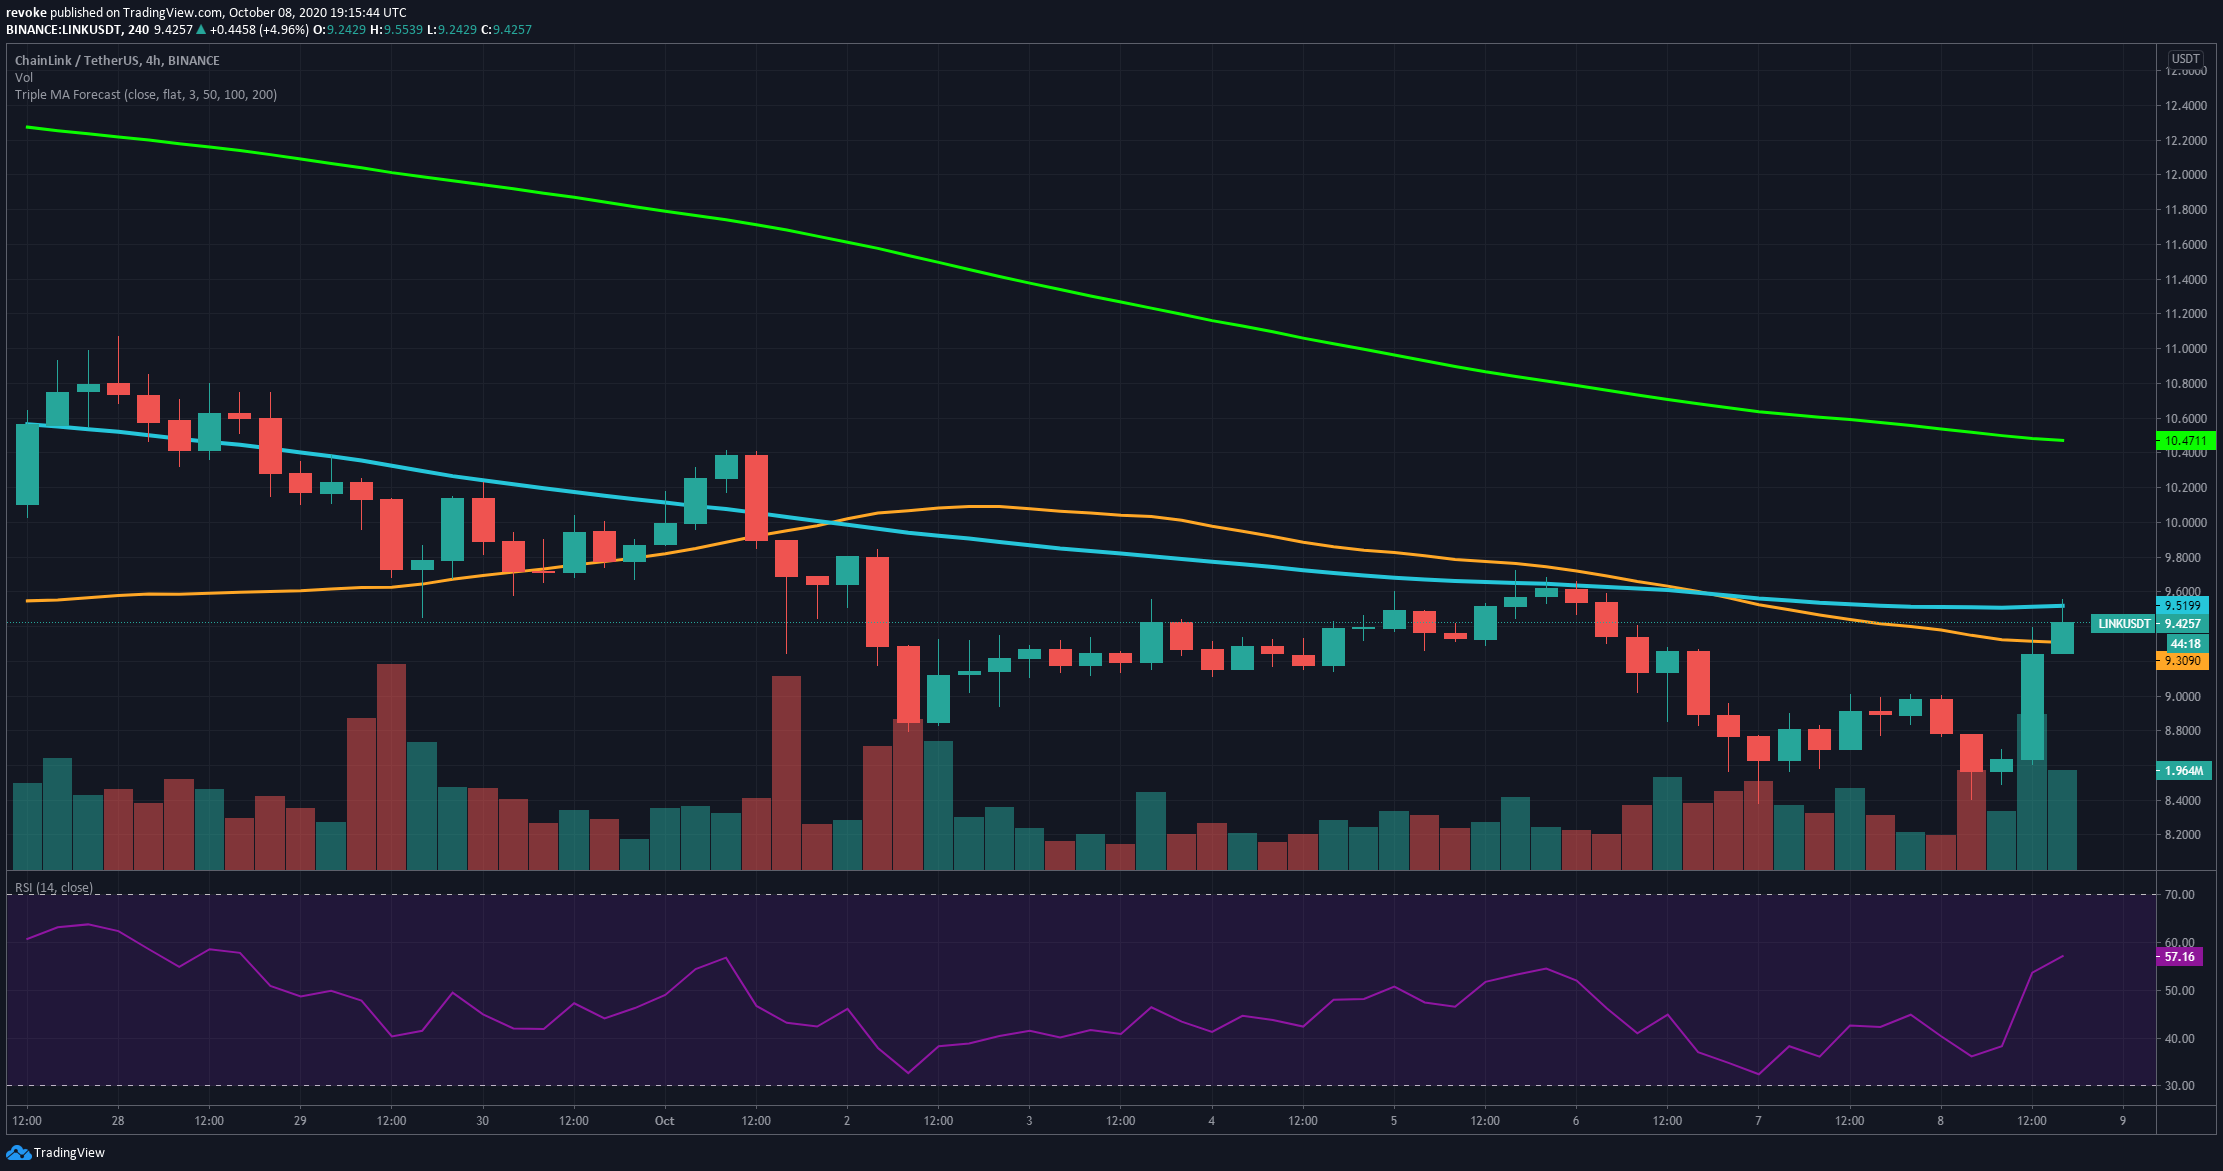
On the 4-hour chart, we have seen a massive 10% spike in price, mostly due to the good news from Square, a company founded by Jack Dorsey, the CEO of Twitter, about buying $50 million worth of Bitcoin.

The price has managed to climb above the 50-SMA and it’s currently trying to crack the 100-SMA. If both levels can be turned into support, LINK will have a real chance to re-test $10 in the short-term.
The next target price would be $10.5 where the 200-SMA currently stands.
What’s the future for LINK?
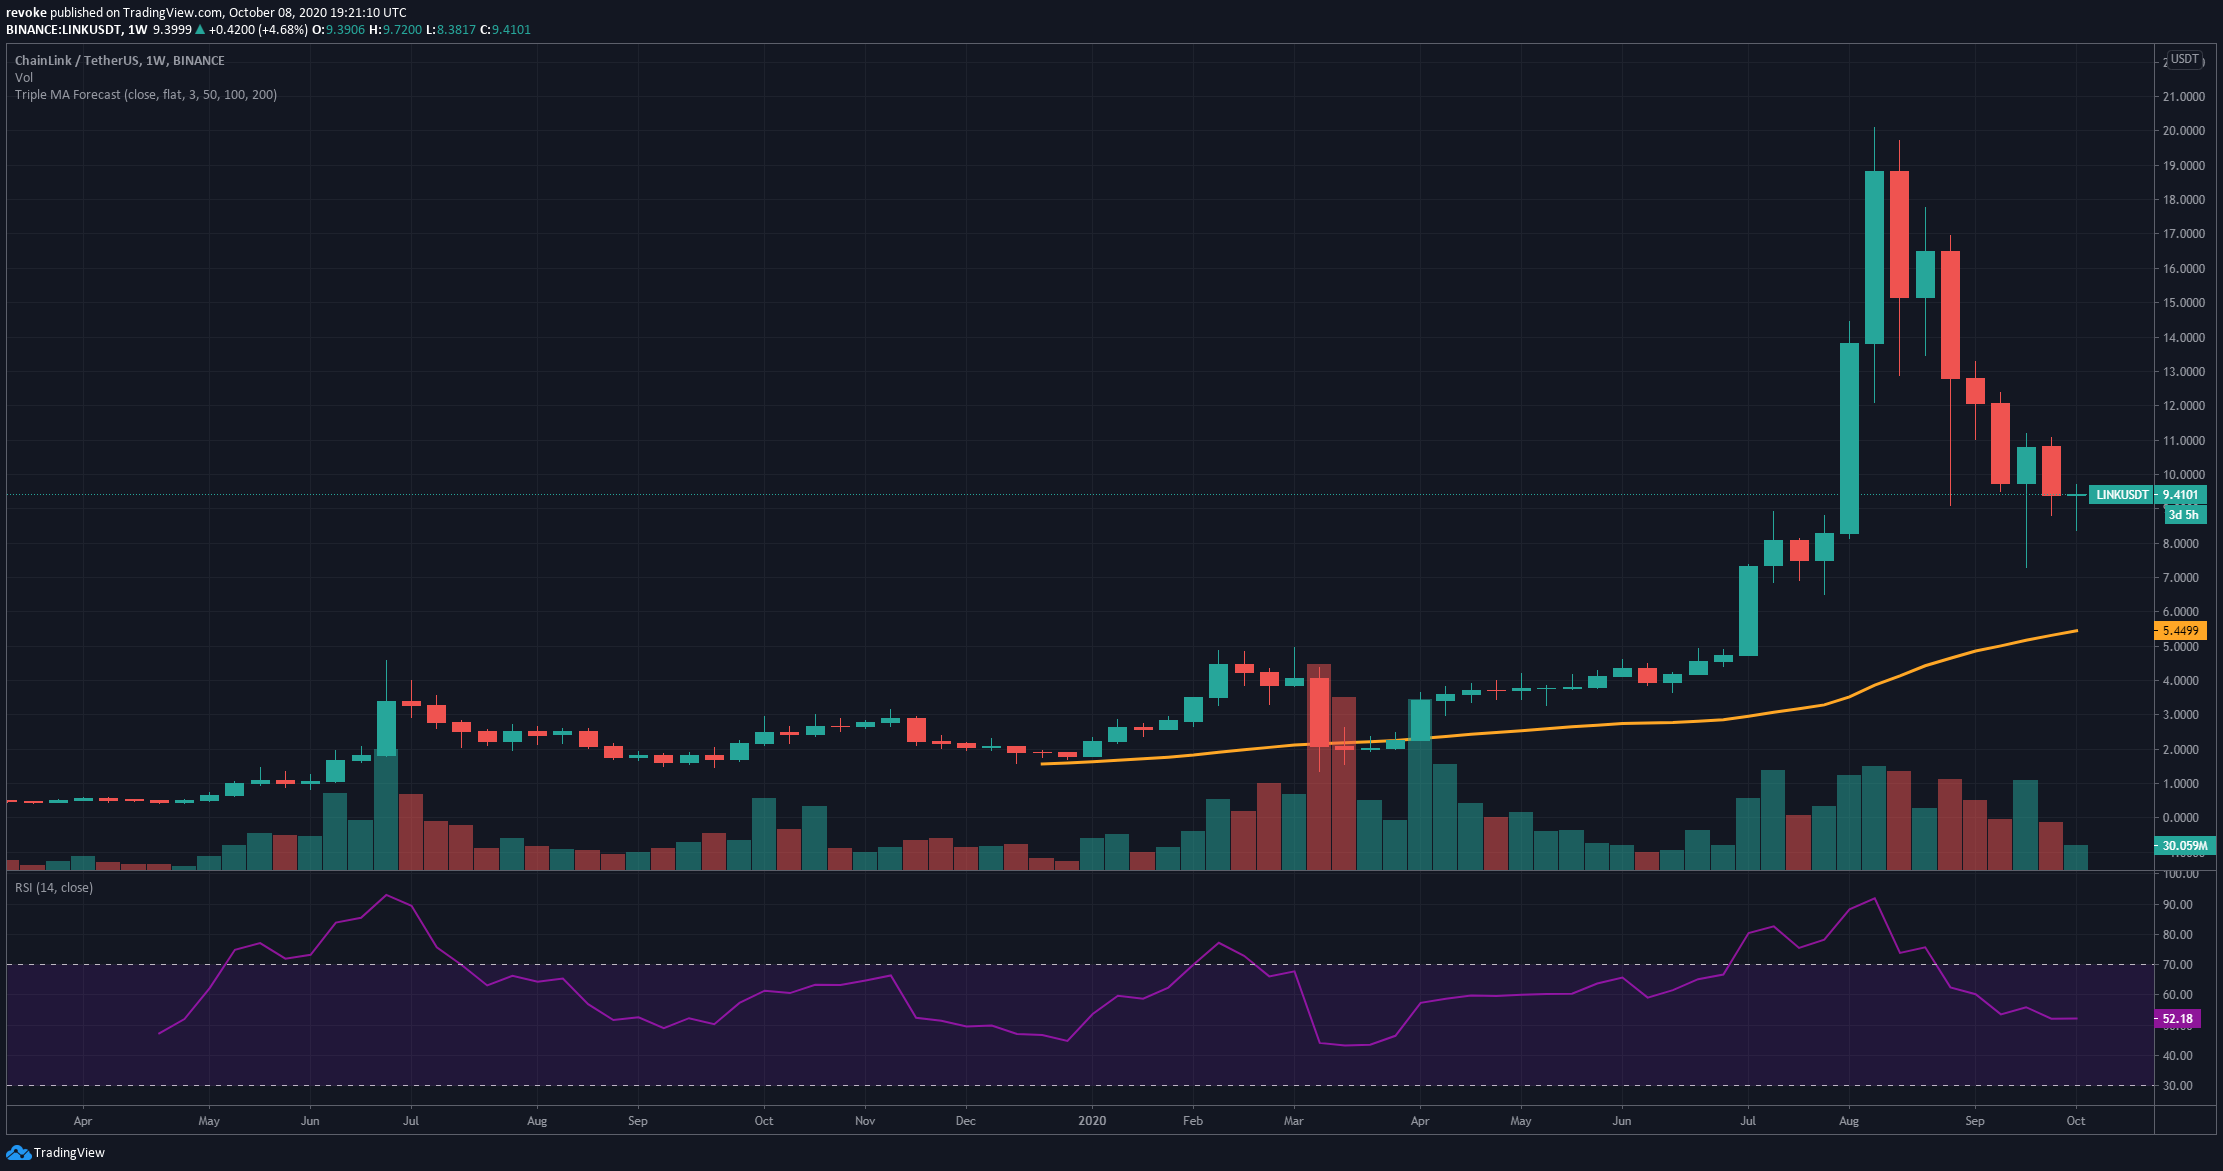
Zooming out to the weekly chart, we can observe that the current uptrend is, in fact, still there. The last real low would be $3.65, which means that any price above this point is simply a higher low and a continuation of the uptrend.

The 50-SMA is established at $5.44 and will act as a strong support level in the case of a crash. The most likely scenario would be an equilibrium pattern with the price creating a higher low followed by a lower high.
Considering the current range between the high and the low, the equilibrium pattern could last for months, into the beginning of 2021.
Follow CryptoTicker on Twitter and Telegram for daily crypto news and price analyses!
 Chainlink Price Analysis© Cryptoticker