Litecoin showed a bullish divergence against Bitcoin, shooting the LTC price up by almost 28%!
Litecoin Price Forecast – bearish divergence in the RSI!
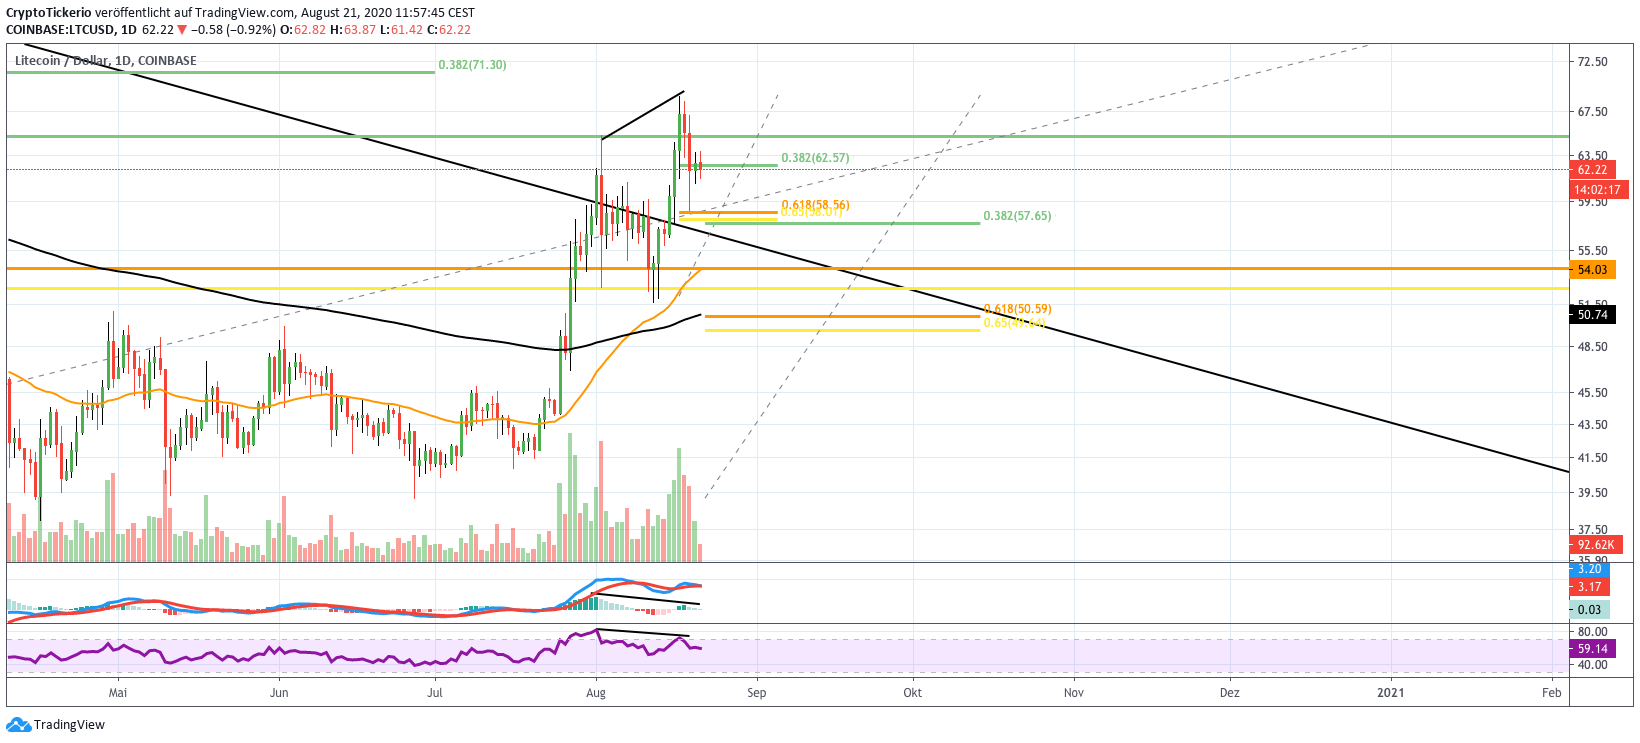 Litecoin 1D chart – Tradingview
In the daily chart, a bearish divergence has formed for the RSI and MACD, after which the Litecoin price fell. Litecoin then found support at the golden ratio at $58. Should Litecoin fail at the 0.382 Fib resistance at $65, a further drop back to the golden ratio support at $50 could be possible.
Otherwise, the golden cross in the 1D chart signals a midterm continuation of the upwards movement.
Litecoin Price Forecast – The triangle was broken, but Litecoin failed at the 200-Weeks-EMA!
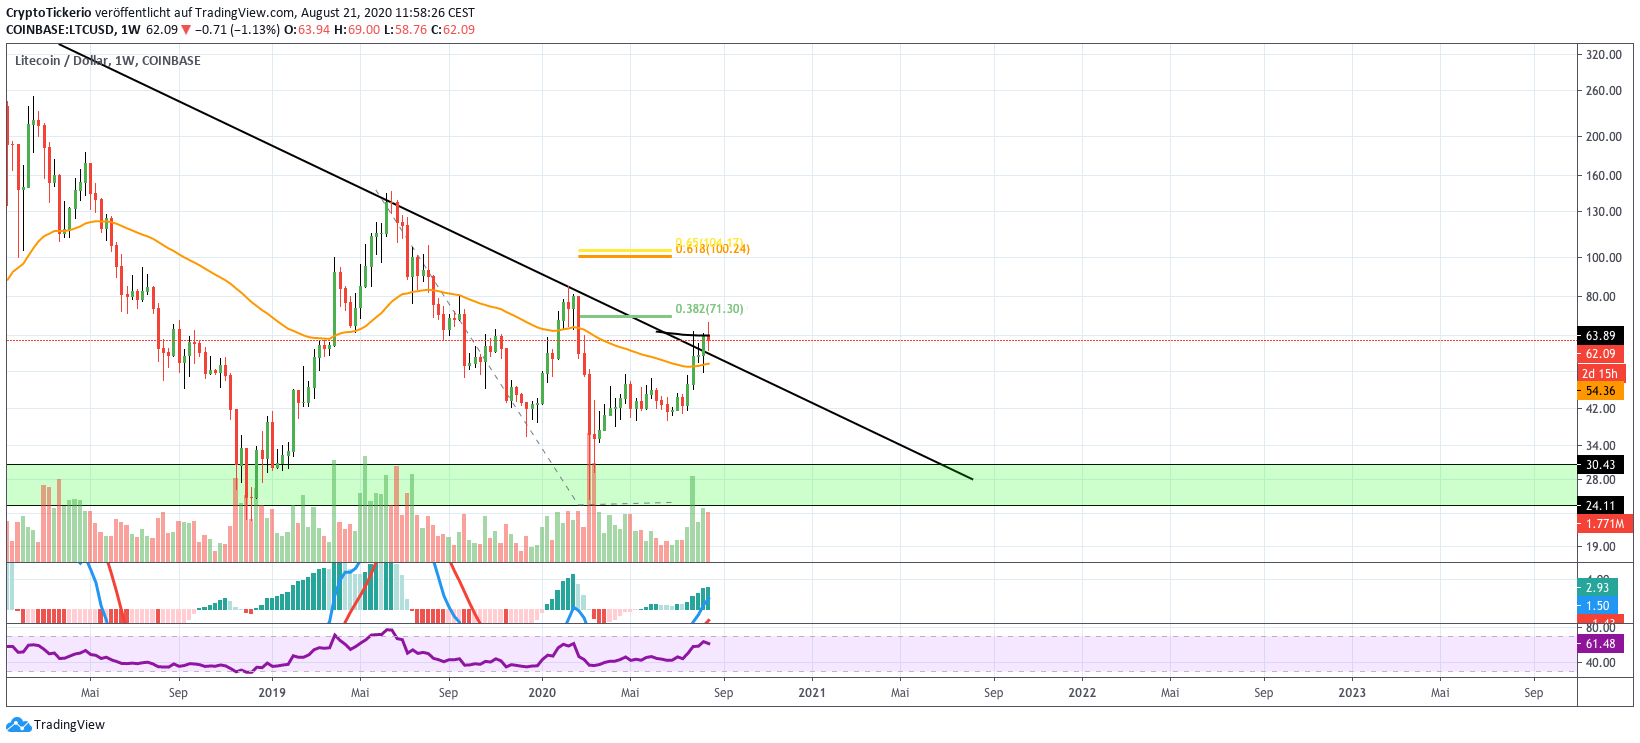 Litecoin 1W chart – Tradingview
Litecoin’s price was able to have a bullish break out of the descending triangle, but then failed to break through the 200-Weeks-EMA around $64. Litecoin finds support at $54 at the 50-Weeks-EMA.
In the weekly chart, the MACD is developing bullishly, and the RSI has room to move upwards as well. the next significant resistances after the 200-Weeks-EMA lie around $71 and around $100.
Litecoin Price Forecast – 61% rise during the DeFi hype!
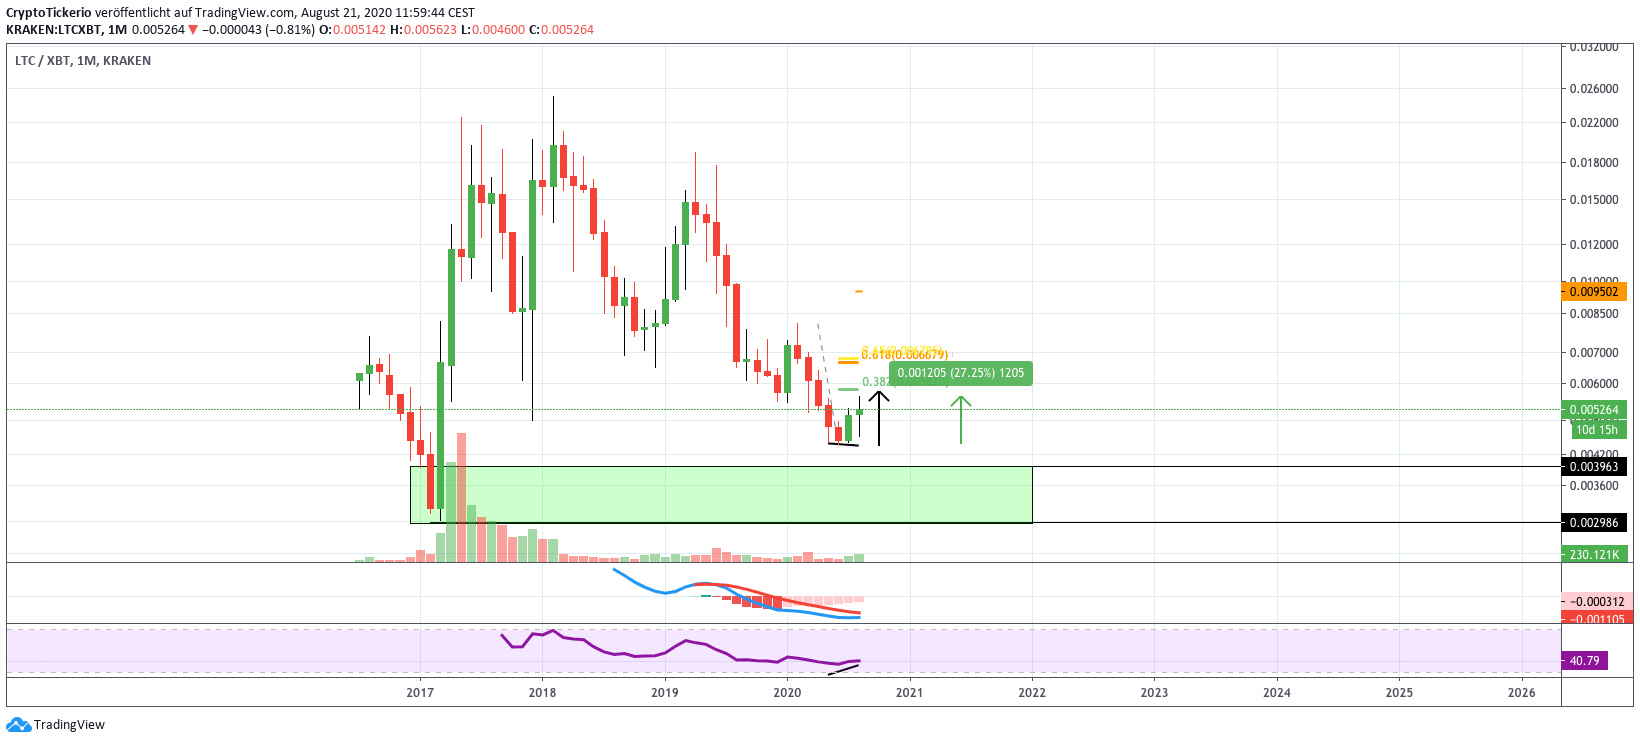 Litecoin 1M chart – Tradingview
Litecoin formed a bullish divergence in the RSI, after which its price rose by 27%. The next significant resistances lay at the Fibonacci levels around 0.0058 BTC and around 0.0066 BTC.
In the monthly chart, the MACD histogram is developing upwards in bullish fashion, and the MACD lines could soon cross in bullish manner as well.
Otherwise, stronger resistance is waiting for LTC between 0.002986 – 0.003963 BTC.
Want more news and price analyses? Join CryptoTicker on Telegram and Twitter