Last week, after the news of Ripple’s complaint to the SEC was released, the price went up by 10%, and the bulls tried to turn the weekly candle green. Despite that, it ended in the red.
Technical Analysis
Technical analysis by Grizzly
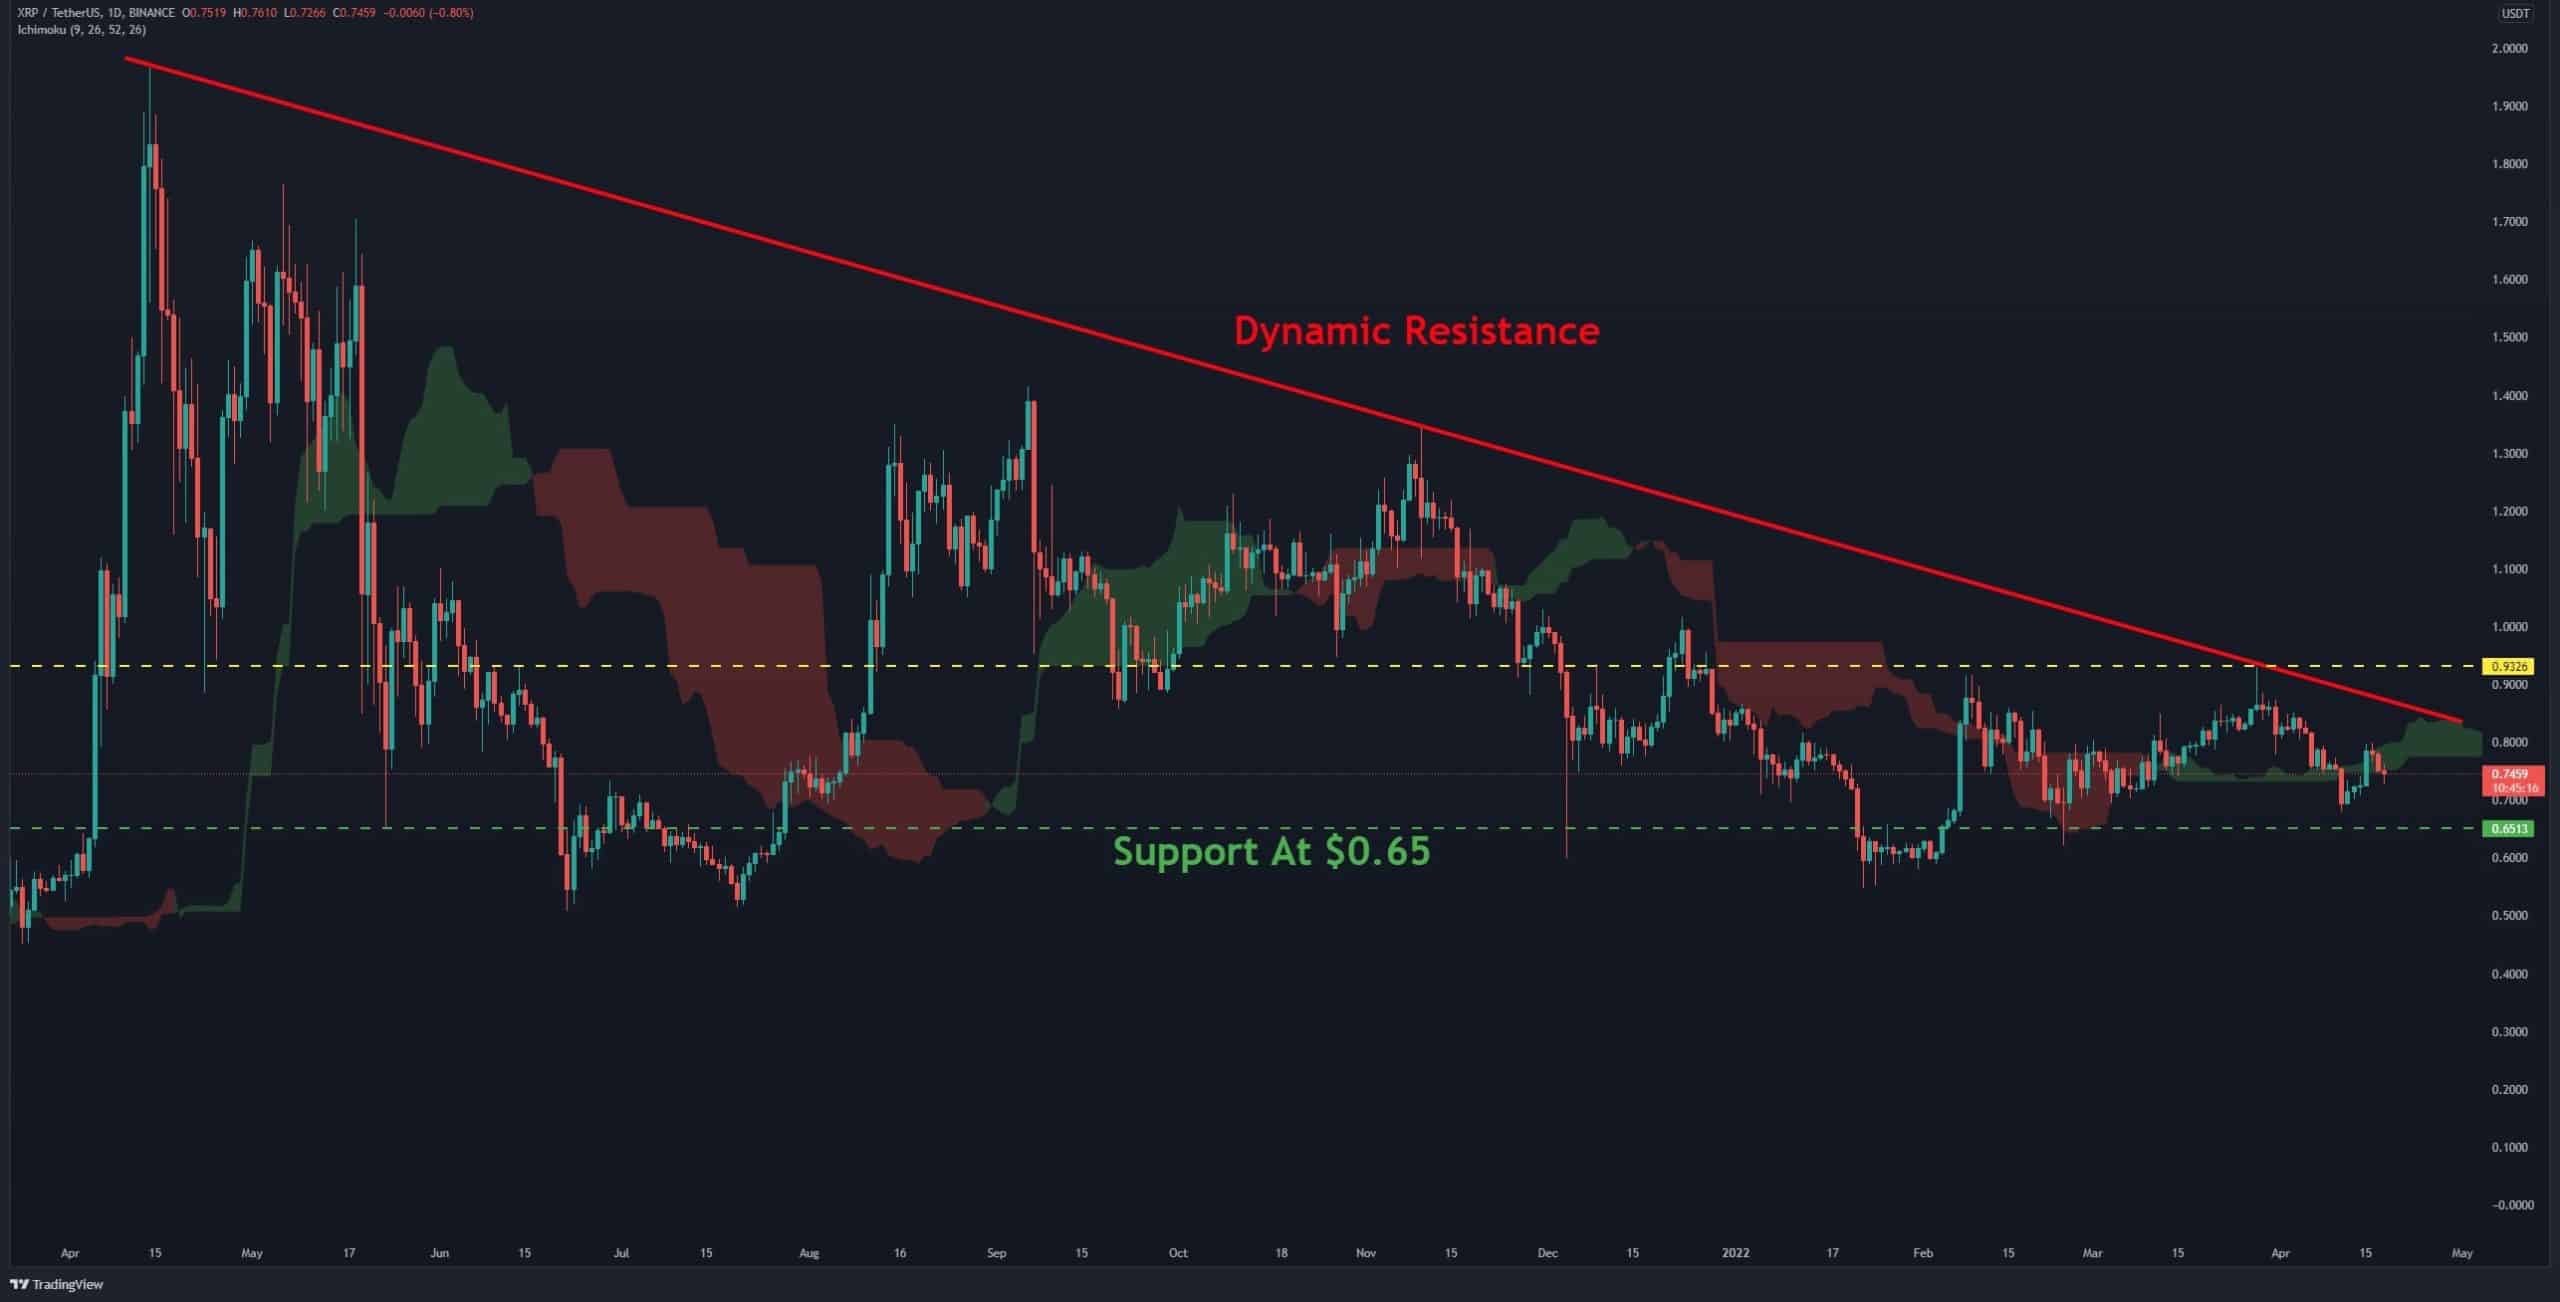
The Daily Chart
On the daily timeframe, the bears defended the resistance at $0.8 and did not allow Ripple to break out of the Ichimoku Cloud, pushing the price down again.
Currently, the cloud, which is getting thicker, along with the dynamic resistance (marked red), are the main challenges for XRP.
This resistance range is between $0.8 and $0.85 and should be easy to get broken. If the bulls can break out of this range, then the resistance at $0.93 (marked red) will likely be tested again. The latter is the level that Ripple failed to break in 2022 in its previous two attempts. On the other hand, the support at $0.65 (marked green) is the first major support to watch.
Moving Averages:
MA20: $0.77
MA50: $0.78
MA100: $0.75
MA200: $0.88
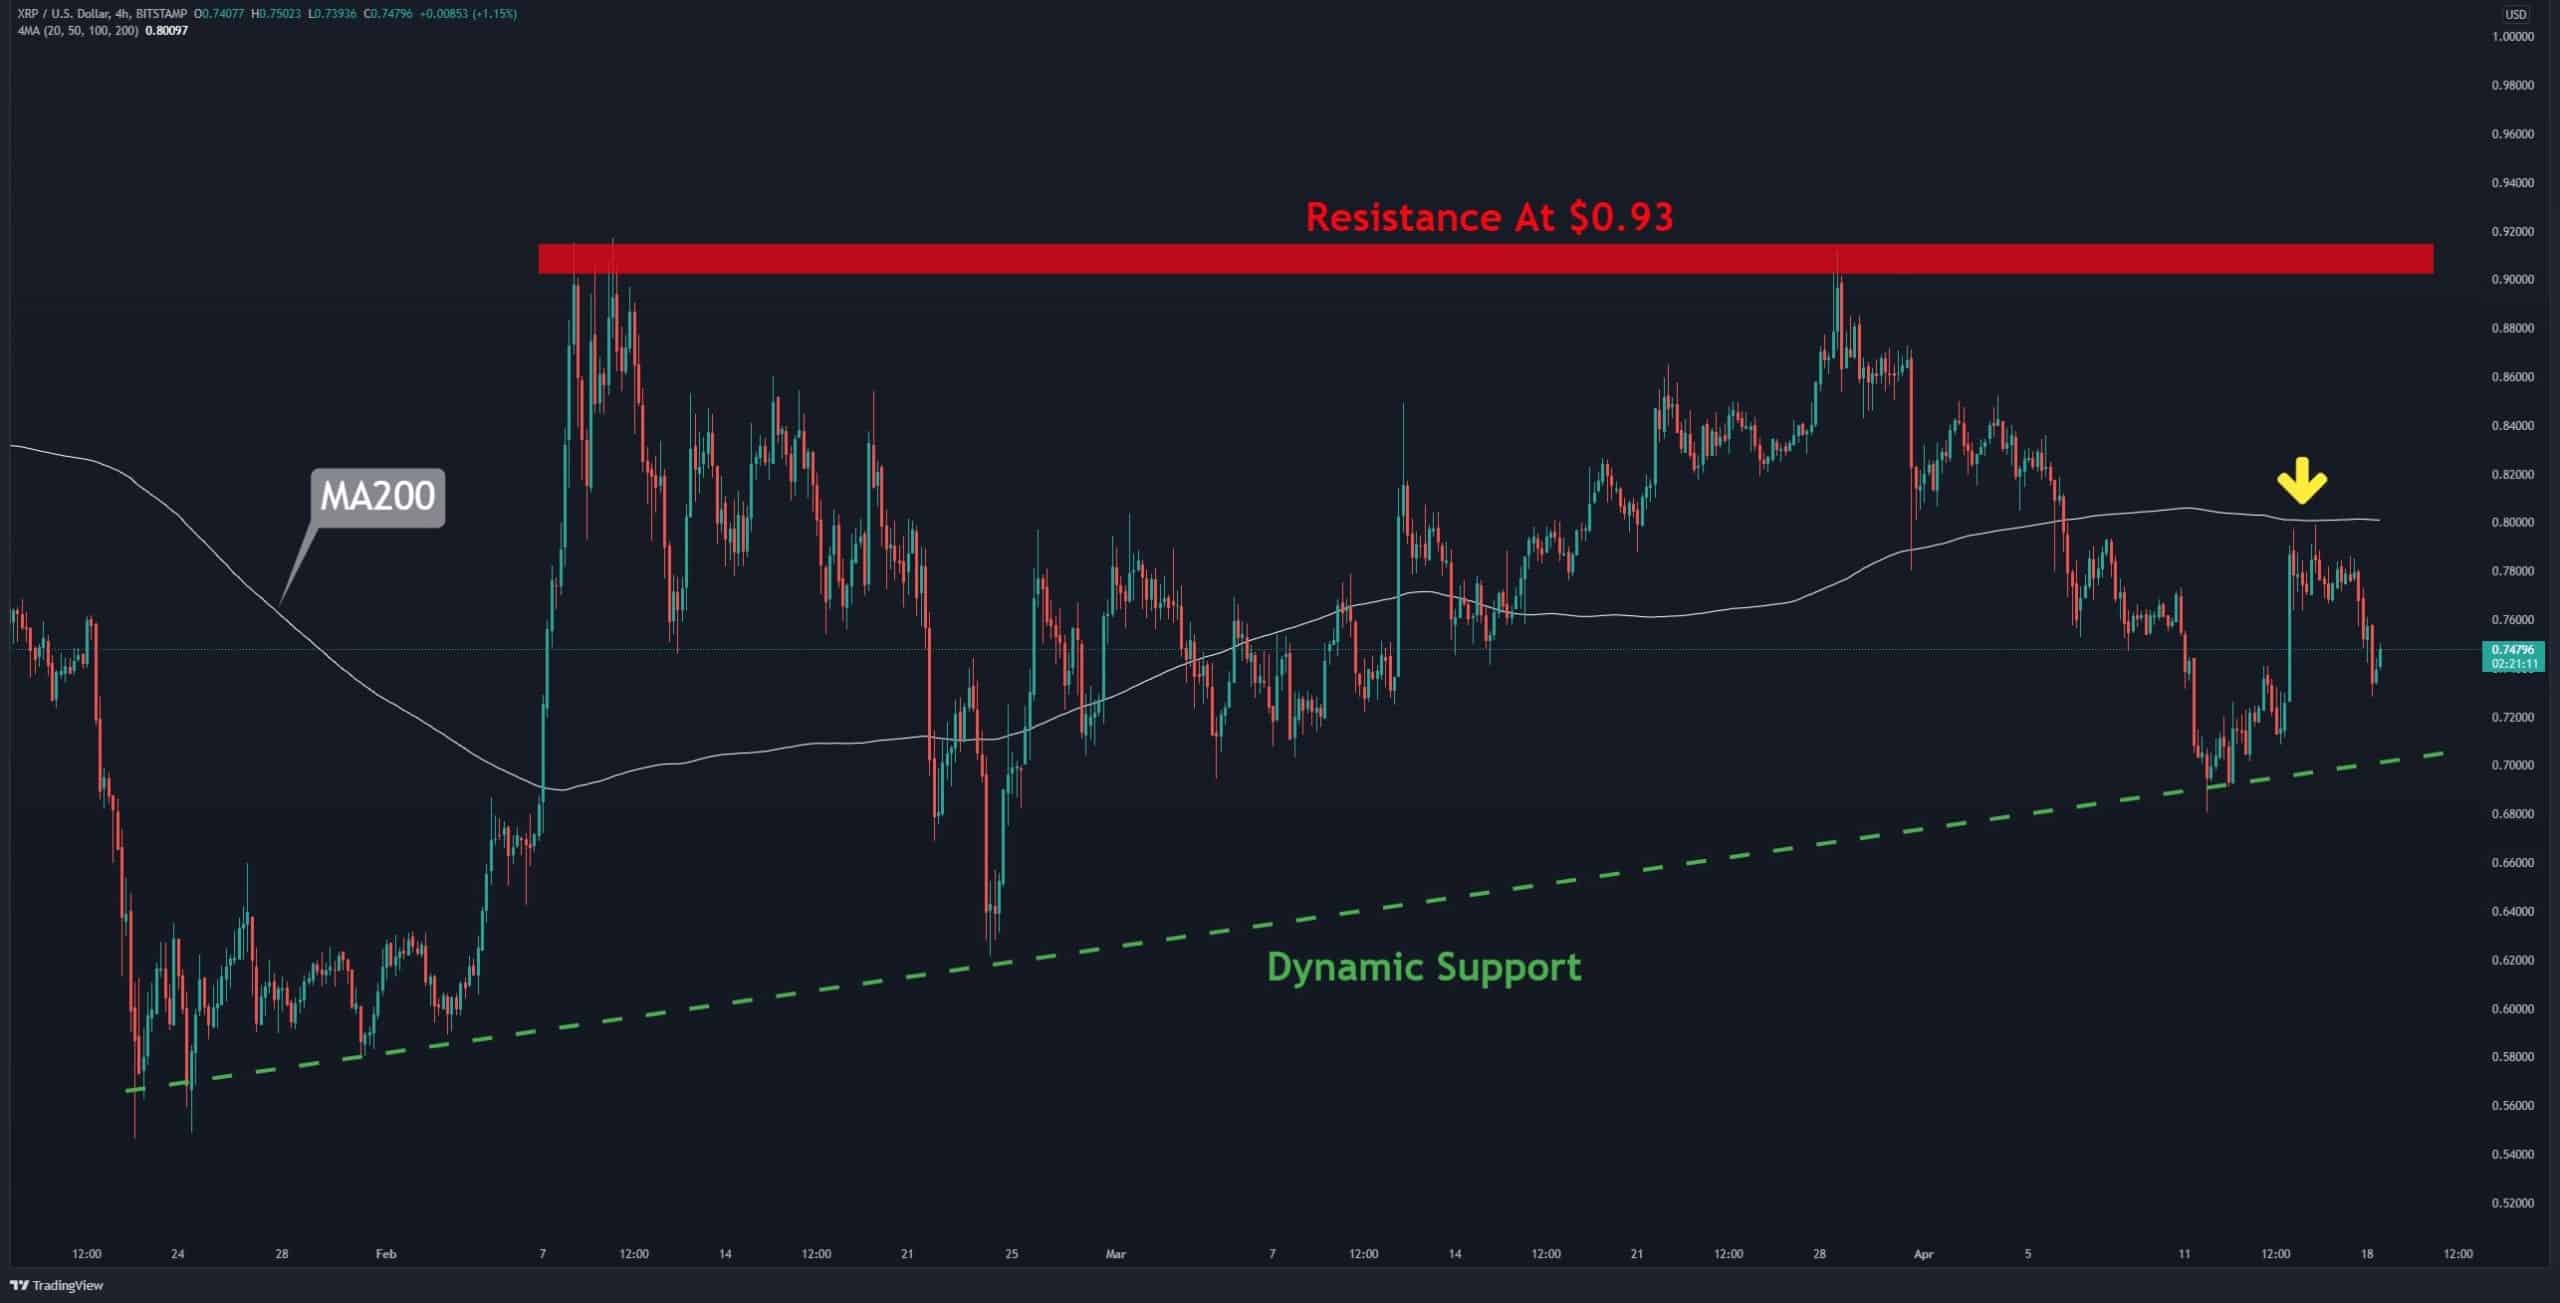
The 4-Hour Chart
On the 4-hour timeframe, Ripple is trading above the dynamic support (marked green). Last week’s spike caused XRP to test the MA200 (marked white) but failed to break above it.
Then, the bears pushed the price down 9% to the Fibonacci Retracement level of 0.618.
If Ripple can break above the resistance at $0.75, it is expected that the MA200 will be tested again; otherwise, the support at $0.7 is the first short-term support on the price path.