- Ripple price remained in a bearish zone below the $0.3150 and $0.3180 resistances against the US dollar.
- The price is consolidating above the $0.3065 and $0.3080 support levels.
- There is a major bearish trend line forming with resistance near $0.3160 on the hourly chart of the XRP/USD pair (data source from Kraken).
- The pair is likely to struggle near the $0.3150, $0.3180 and $0.3200 resistance levels.
Ripple price is trading below many key resistances against the US Dollar and bitcoin. XRP price could start a fresh increase once there is a daily close above $0.3200.
Ripple Price Analysis
In the past few sessions, there was a steady decline in ripple price from the $0.3320 swing high against the US Dollar, while Ethereum and bitcoin remained stable. The XRP/USD pair broke many key supports near the $0.3220 and $0.3200 levels to enter a bearish zone. Moreover, there was a break below the $0.3150 support and the 100 hourly simple moving average. Finally, the price broke the $0.3100 level and traded to a new weekly low near $0.3065.
Recently, there was an upside correction above the $0.3125 level. Moreover, the price broke the 23.6% Fib retracement level of the downward move from the $0.3320 swing high to $0.3065 low. However, the upward move was capped by the $0.3150-0.3160 resistance area. Additionally, the price remained well below the 50% Fib retracement level of the downward move from the $0.3320 swing high to $0.3065 low.
As a result, the price declined again and retest the $0.3065 level. It seems like there is a strong resistance forming near the $0.3150 and $0.3160 levels. Furthermore, there is a major bearish trend line forming with resistance near $0.3160 on the hourly chart of the XRP/USD pair. Therefore, a successful break above $0.3150 and the bearish trend line might push the price further higher.
The main resistances are near $0.3200 and $0.3220, above which the price could start a fresh increase towards the $0.3320 level. On the downside, an immediate support is near the $0.3065 level. If the bulls fail to defend the $0.3065 support, the price could retest the $0.3000 support in the near term.
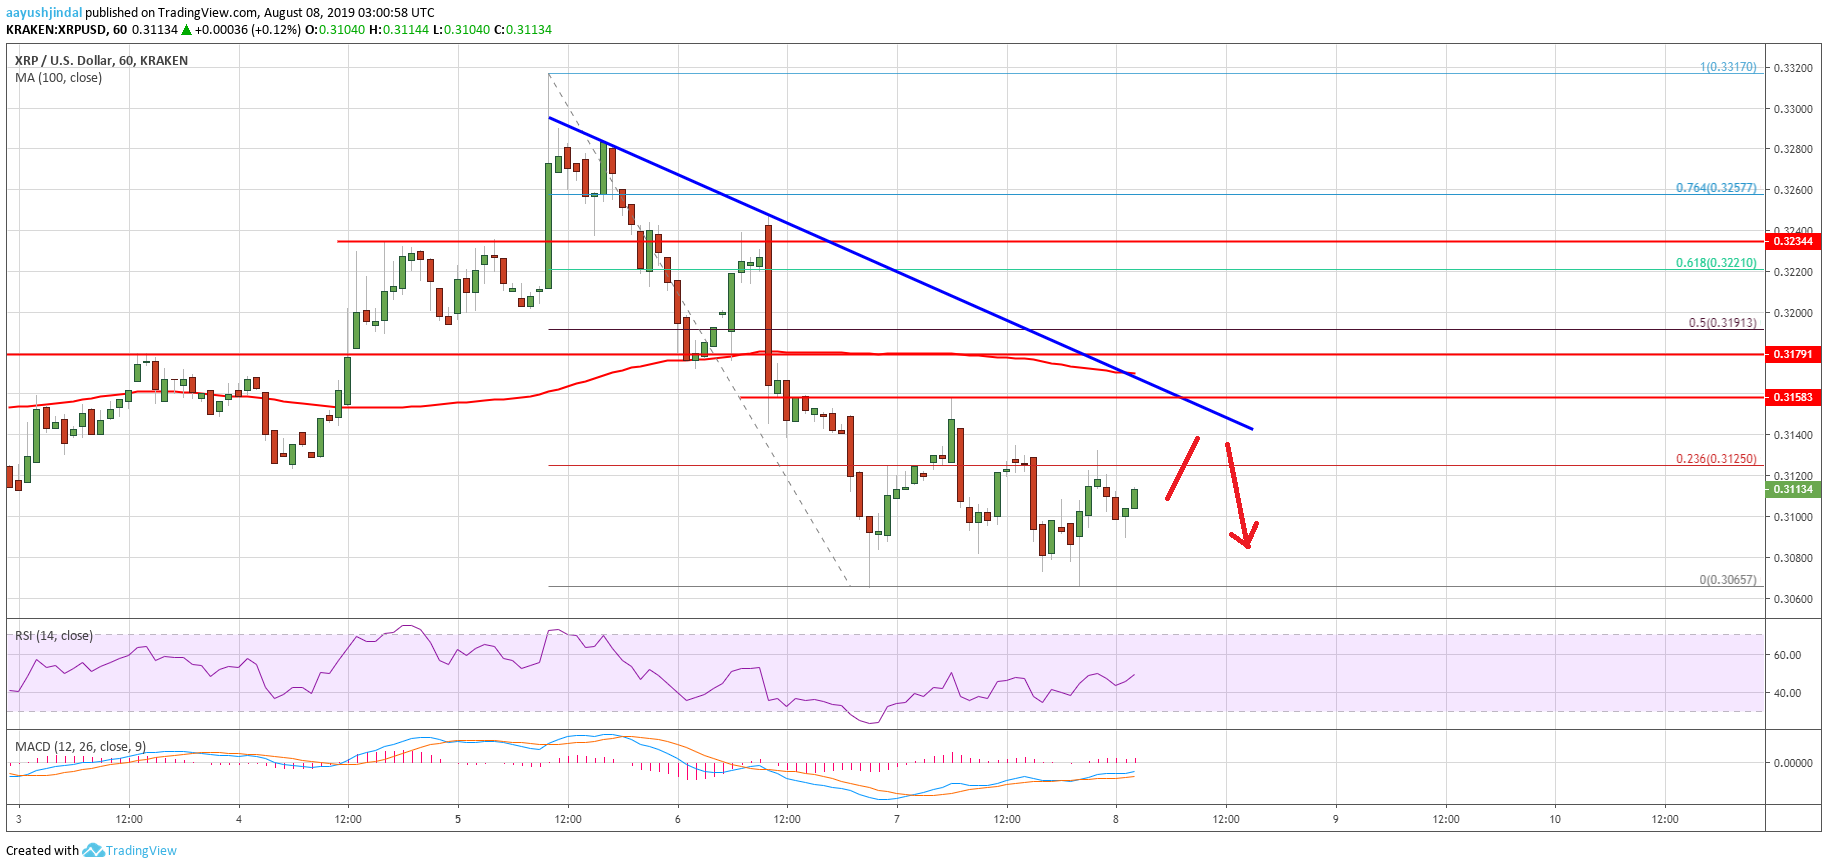
Looking at the chart, ripple price is facing an uphill task near the $0.3150, $0.3160 and $0.3200 levels. As long as the price is below the mentioned levels, there is a risk of more downsides below the $0.3065 support.
Technical Indicators
Hourly MACD – The MACD for XRP/USD is slowly moving in the bullish zone.
Hourly RSI (Relative Strength Index) – The RSI for XRP/USD is still below the 50 level, with a bearish angle.
Major Support Levels – $0.3080, $0.3065 and $0.3020.
Major Resistance Levels – $0.3150, $0.3160 and $0.3200.
The post Ripple Price (XRP) Facing Many Hurdles While Bitcoin Testing $12K appeared first on NewsBTC.