After a prolonged period of sideways trading, Bitcoin’s volatility is starting to return to normal levels, with the cryptocurrency now venturing towards the top of its macro trading range.
Overnight, buyers were able to send BTC’s price flying past the five-figure price region, although it faced a firm rejection at $10,200 that caused its price to slide back below $10,000.
Throughout 2020, Bitcoin has broken above $10,000 on countless occasions, with each one proving to be fleeting and followed by further downside.
One indicator is showing that this time may be different.
A measurement of on-chain economic activity suggests that long-term investors aren’t selling at the moment – unlike previous breaks above this crucial psychological price level.
Bitcoin’s volatility returns as bulls battle for control of $10,000
Just one week ago, Bitcoin was caught within its tight multi-week consolidation channel between $9,100 and $9,300.
This trading range formed as a result of low liquidity and trading volume that had plagued the benchmark cryptocurrency, which came about as a result of investors placing an increased focus on altcoins.
Over the past few days, however, this trend has started shifting, with BTC breaking out of this trading range and rallying to highs of $10,200 that were set overnight.
The visit to these highs was fleeting and was quickly followed by a sharp selloff that led it to lows of $9,800.
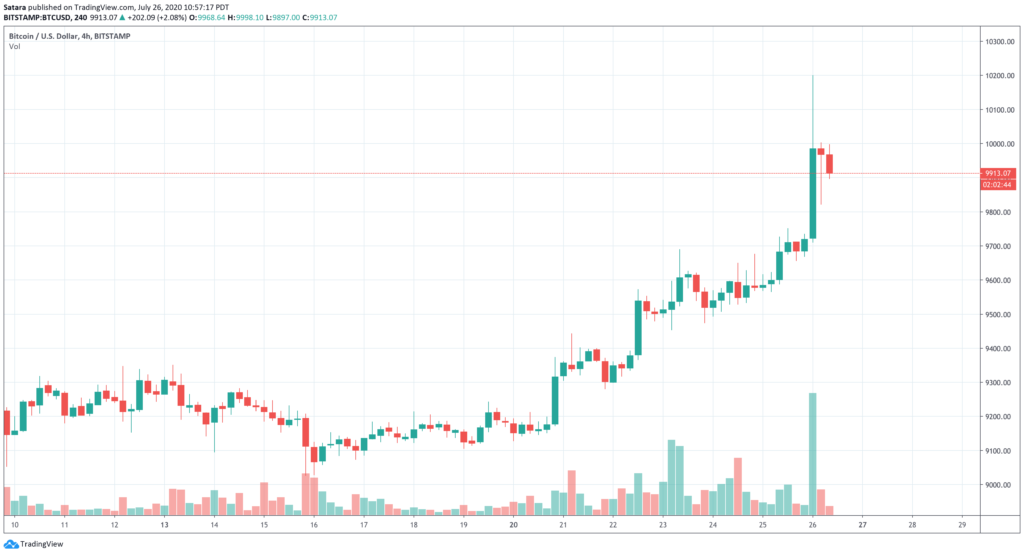 Chart via TradingView
Now, buyers are once again attempting to propel the cryptocurrency past the massive resistance that sits at $10,000.
Here’s why this rally to $10,000 is different from past ones
Bitcoin has visited the five-figure price region on many occasions over the past few months, with each one resulting in a swift rejection and subsequent downtrend.
This time may be different, however, as one on-chain indicator is flashing a positive sign for the benchmark digital asset.
According to Glassnode’s “Coin Days Destroyed” indicator, during past rallies to $10,000, investors offloaded a significant amount of “old Bitcoin” that had previously sat dormant within their wallets.
This time, however, the CDD indicator shows that investors are not selling their “old” Bitcoin. The analytics firm explained this in a recent post:
“In contrast to the last two times BTC hit $10,000 USD, we haven’t seen an increase in Bitcoin Days Destroyed today.”
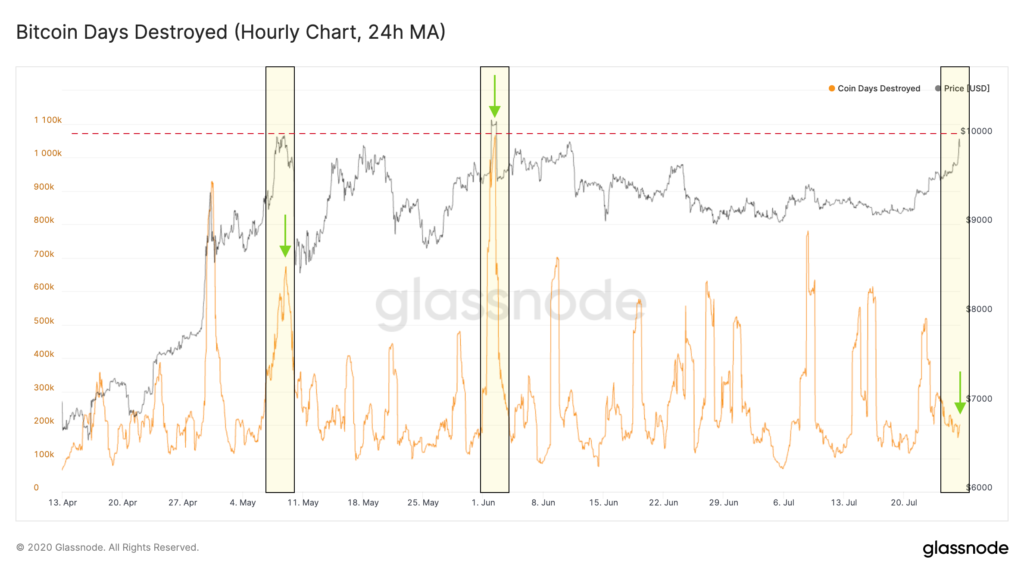 Data Source: Glassnode
The reason why investors may not be selling their long-term holdings during this latest movement is due to a shift seen in the entire crypto market, as many altcoins are showing immense signs of strength.
This market-wide uptrend has also boosted investor sentiment, causing many to call for an imminent uptrend.
Because investors aren’t selling into this latest rally, the ongoing uptrend may prove to be far more sustainable than those seen in previous months.
The post This on-chain metric suggests Bitcoin’s next big rally may just be getting started appeared first on CryptoSlate.