The altcoin market has always mirrored the price movements of Bitcoin. The previous week was witness to a similar situation, with XRP’s value dropping by over 20 percent since the start of the month. However, in the long run, the crypto may note a bit of bullish momentum as it has been trading around the $0.24 – $0.29 price range for over a month, with XRP looking to head upwards, at press time.
At the time, XRP was being traded at $0.242, while registering a market cap of $10.9 billion. The slight bullishness in XRP’s price was visible on the 24-hour chart, with the crypto’s price rising by 1.5 percent over the same period while registering a trading volume of $1.7 billion.
XRP 1-day chart

Source: XRP/USD, TradingView
According to XRP’s daily chart, the coin’s price action has been part of a descending channel formation for over a month now. The late-July uptrend for the coin initiated the descending channel and since the start of August, the cryptocurrency has been confined within its price range. The breakout of a descending channel is, in most cases, beneficial for the coin’s price. However, given XRP’s press time price action, it is likely to remain within the formation over the coming week. Further, in the process of continuing to do so, the price may also rise to touch the resistance level at $0.265.
At the time of writing, XRP was testing its support level at $0.234. However, if the bearish pressure were to increase, a dip to the support level at $0.208 is also possible.

Source: XRP/USD, TradingView
Taking into account the indicators for XRP, strong bullish sentiment was found to be lacking. The MACD indicator had undergone a bearish crossover, but the possibility of a reversal remained as the signal line was moving towards the MACD line. Further, the RSI was closer to the oversold zone, but showed a slight inclination to head towards the neutral zone.
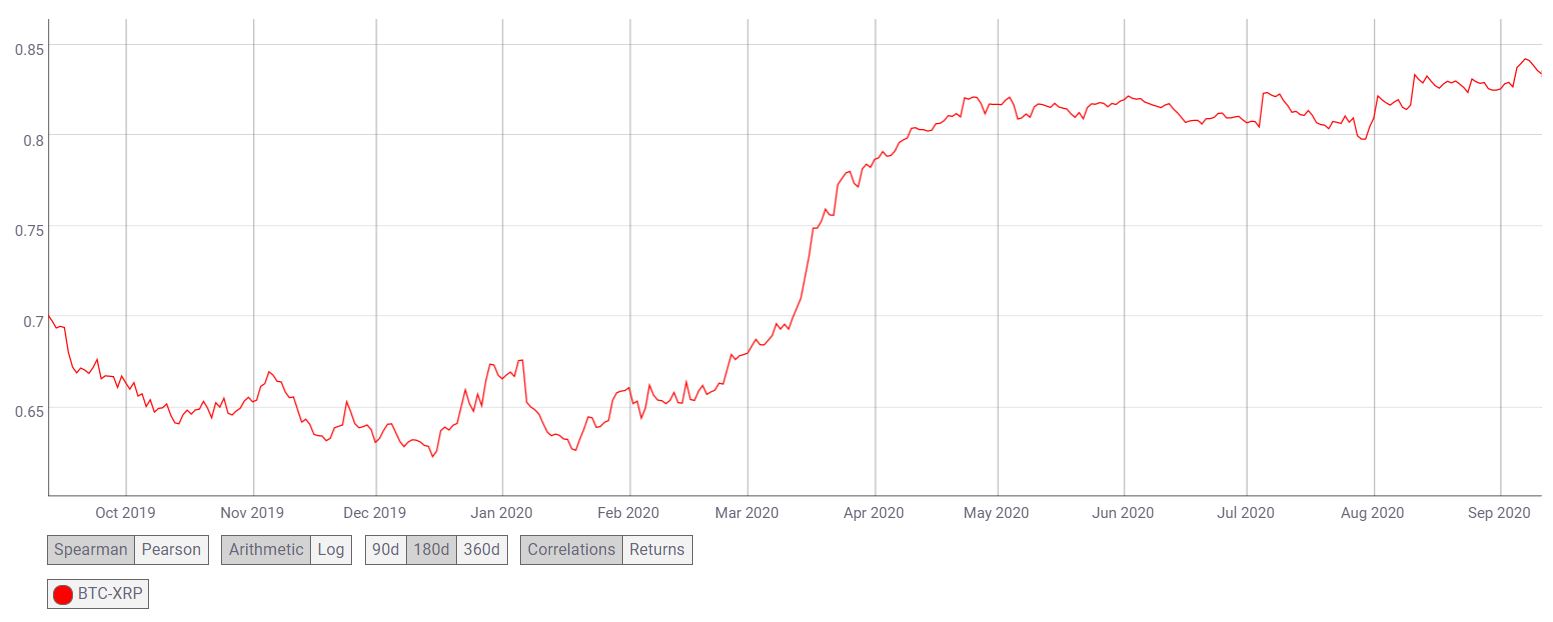
Source: CoinMetrics
Taking a look at the correlation chart for XRP, it is evident that akin to much of the altcoin market, Bitcoin’s price action does hold significant sway. In the past year alone, the correlation between XRP and BTC has risen from 0.70 to 0.83.
Conclusion
XRP’s price action on the charts over the past month has noted a significant downtrend. Taking into consideration the indicators and the price movement, in the coming weeks, the coin may see a slight improvement in terms of price as it is likely to remain with the formation, but will move towards its resistance at $0.265. However, if there is considerable bullish sentiment, then the price action of XRP may break out of the formation and head towards its second resistance level at $0.290.
The post XRP long-term Price Analysis: 12 September appeared first on AMBCrypto.