It seems that the XRP price wants to make a statement in the next few days. The Ripple price is in the green zone from the past few days. The latest XRP price is $0.314 (+5.22%). In our previous Ripple price analysis, we had mentioned that price is showing bullish behavior and it is in an uptrend but there are still some resistance levels to conquer. The trading volume is growing and the RSI is still not overextended. The bulls are somewhat facing the 200-EMA resistance at $0.319. So, how high can Ripple price go in 1 month? Let’s take a look at it in more detail.
XRP Price Analysis: Ripple Price and Bulls are Climbing
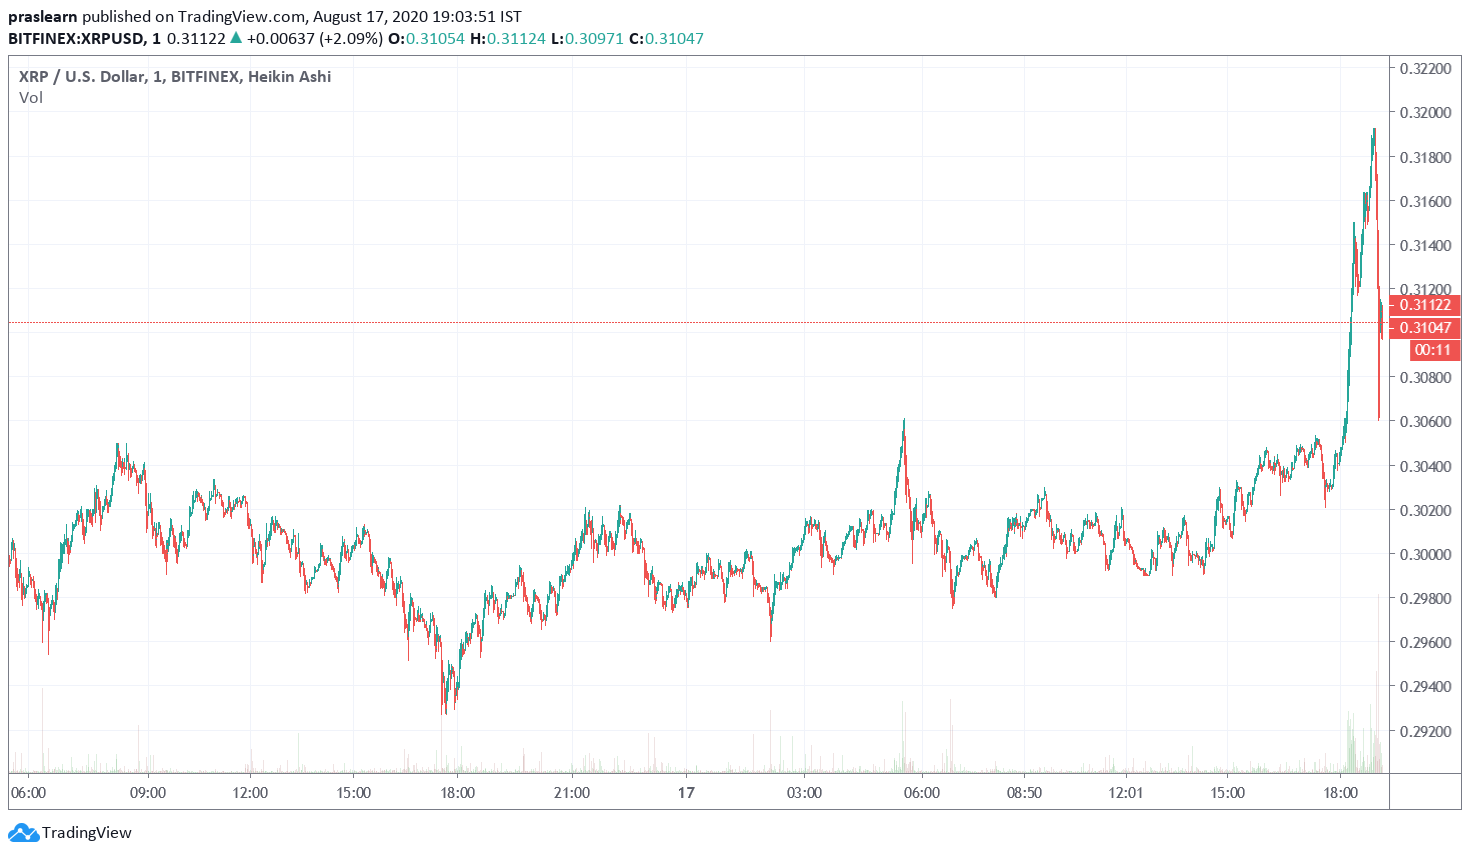
At the moment, bulls have a lot of momentum and they could climb above $0.315 in the next few hours. The percentage change in the current market cap of XRP against USD, compared with 24hrs ago, is grown by almost +2.71%. On the other hand, the percentage change in the Bitcoin-denominated current market cap of XRP, compared with 24hrs ago is increased by almost 1.86%. The daily chart is looking bullish with the MACD displaying notable bull momentum and both EMAs on the edge of a bull cross. The key metrics are as follows:
Price $0.314
24hr Change +5.22%
24hr Vol $247,770,997
Liquid Marketcap $9,698,791,835
Liquid Supply 31,906,660,874
XRP Price Analysis: Ripple Price Monthly Chart Analysis
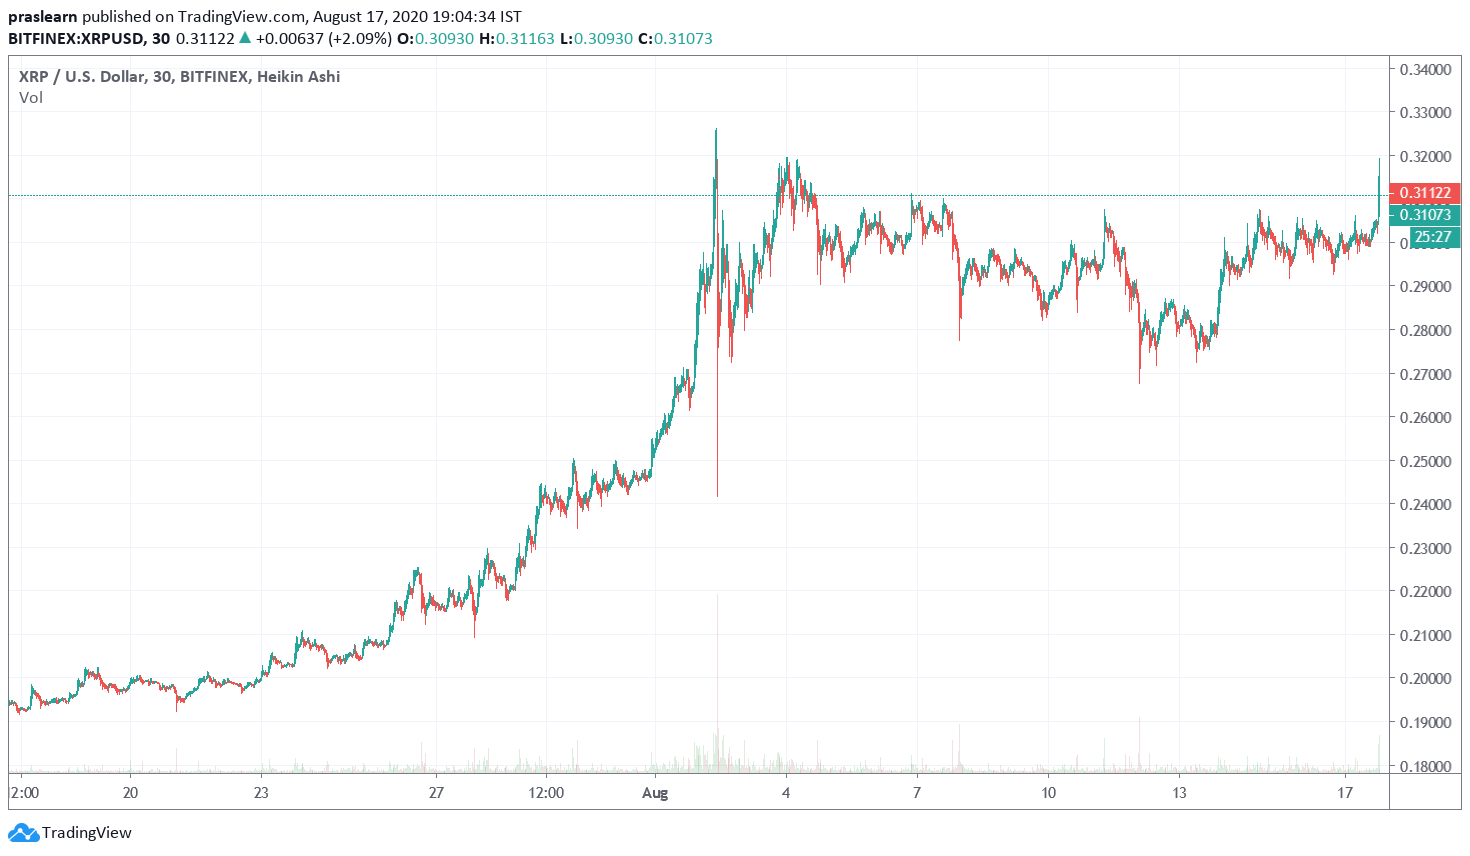
The Ripple price has been in a downtrend since December 2017 but now a breakout above $0.340 would establish an uptrend. During the last 90 days, the XRP price has increased by almost 47%.
The next resistance level for XRP/USD could be at $0.319, which is the 26-EMA. The price is also meeting all the other short-term resistance points. The RSI is almost in the middle and could now play a vital role in XRP’s price gains. Bulls would prefer to view XRP close above the 26-EMA this month and strengthen up above the resistance at $0.346 establishing a monthly uptrend. The range between the XRP’s lowest and highest trading prices, over the last hour is $0.305 – $0.320. The next few days will be crucial for XRP to gain proper momentum.
XRP Price Analysis: How high can Ripple price go in 1 month?

Now, the question is how high can XRP/USD price go in one month? If we closely analyze then we will find that the technical analysis is the forecasting of projected economic price changes based on an analysis of past price changes. It is always important to remember that technical analysis does not end in certain forecasts about the future. Alternatively, a technical summary can help everyone predict what is “expected” to appear to prices over time. Technical analysis uses a wide variety of charts that show price over time.
At the moment, if XRP price succeeds to stay above $0.310(Fibonacci 26.7% retracement, it could seek to touch $0.319 and $0.346, the yearly high. Also, the supports are placed at $0.293, $0.281, and $0.272.
The next supports could be at $0.319, $0.328, and $0.338 respectively. Now, Support is the price at which the market is thought to be influential enough to stop the price from decreasing further. The logic prescribes that as the price decreases towards support and becomes more affordable, buyers become more likely to purchase and sellers become less willing to trade. By the time the price touches the support, it is supposed that demand will overwhelm supply and stop the price from declining below support.
Now, if we take a look at resistance, then resistance is the price at which trading is thought to be influential enough to limit the price from increasing further. Logic prescribes that, as the price drives towards resistance, traders become more likely to trade and buyers become less willing to purchase. By the time the price touches the resistance, it is assumed that supply will overwhelm demand and stop the price from increasing above the resistance.
- XRP Price All-Time High $3.84 USD(Jan 04, 2018)
- All Time Low $0.002802 USD(Jul 07, 2014)
- 50 Week High $0.343972 USD
- 50 Week Low $0.115093 USD
In the trading world, the Chaikin Money Flow’s Value swings between 1 and -1. Now, here if we apply the Chaikin Money Flow (CMF),with the following previous details of XRP/USD for 20 or 21 days:
Money Flow Multiplier = [(Close price – Low price) – (High price – Close price)] / (High – Low)
Now if we apply the above formula then the CMF value fluctuates between 1 and -1. The basic interpretation is:
- When CMF is closer to 1, buying pressure is higher.
- When CMF is closer to -1, selling pressure is higher
Now, at the moment in bullish market, the constant buying pressure or we can say the Chaikin Money Flow of XRP price is above 0 and it is positive and it may indicate that XRP price will continue to climb and could touch $0.315 and more.
Conclusion
The next resistance level of XRP price could be at $0.319, which is near the 25-EMA but XRP is also meeting all the other short-term resistance points. The RSI could be in the center and could be accountable for no influence on XRP’s price but in the next 25 days the XRP price could be betweeen $0.318-$0.332. We wish you happy trading!
 XRP Price Analysis© Cryptoticker